Download
1 / 16
170 likes | 423 Vues
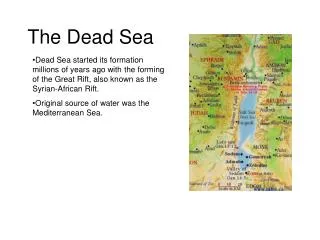
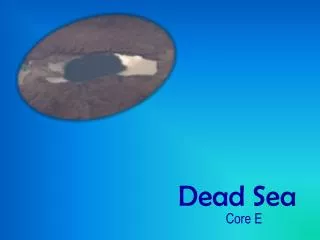
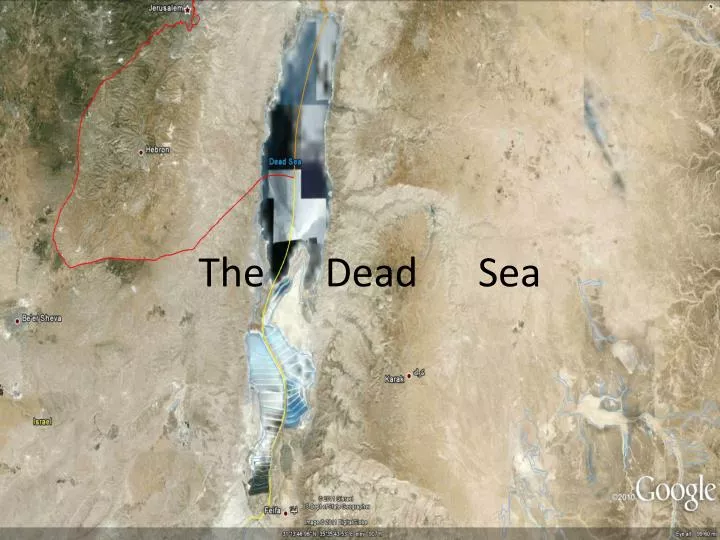
The Dead Sea. Location/Formation. Located between Jordan, The West Bank, and Israel. Just outside of the traditional tropics, between 30.5 and 31.5 degrees north latitude The Dead Sea Transform The DST is located between the African and Arabian tectonic plates.

E N D
Location/Formation • Located between Jordan, The West Bank, and Israel. • Just outside of the traditional tropics, between 30.5 and 31.5 degrees north latitude • The Dead Sea Transform • The DST is located between the African and Arabian tectonic plates.
Weather and Climate • Hot and dry climate • Average rainfall: 47 mm • Average precipitation days: 15 • Average summer temperature: 27 – 40 oC • Average winter temperature: 11 – 21 oC • Average yearly temperature: 22 – 30 oC
Sources of Inflow Inflow: • Ground water • Rain water • Surface water • Jordan River, • Zerqa, • Mujib, • Karak, • Hasa, • Araba, • Harod, • Quilt, • Malih, • Mishash, • Arugot,
Morphometric Data • Max length • Max width • Surface area • Average depth • Max depth • Water volume • Shore length • Density ======== = 67 km 18 km 810 km2 118 m 377 m 147 km3 135 km 1.24 kg/L
Salinity • 33.7% salinity • 8.6 times saltier than the oceans • There is roughly 300 grams of salt per kilogram of seawater • There are 35 different types of minerals that make up the salts in the lake
Chemical Composition (in G l -1): • Mg = 44 • Ca = 17.2 • Na = 40.1 • K = 7.7 • Cl = 224.9 • Br = 5.3 • SO4 = 0.45 • HCO3 = 0.1 • Total Dissolved Salts = 339.6 • Density = 1.232
Life in and around the Dead Sea Recorded to have been seen near the Dead Sea Lake: • Camels • Ibex • Hares • Hyraxes • Jackals • Foxes • Leopards • Birds • 152 species of plankton and periphyton were identified in the Jordan River (Tavassi 2008). • Cyanoprokaryota • Bacillariophyceae • Chlorophyta • Chrysophyta • Cryptophyta • Dinophyta • Euglenophyta • Rhodophyta • Xanthophyta
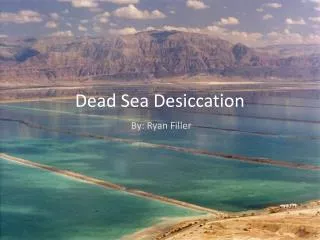
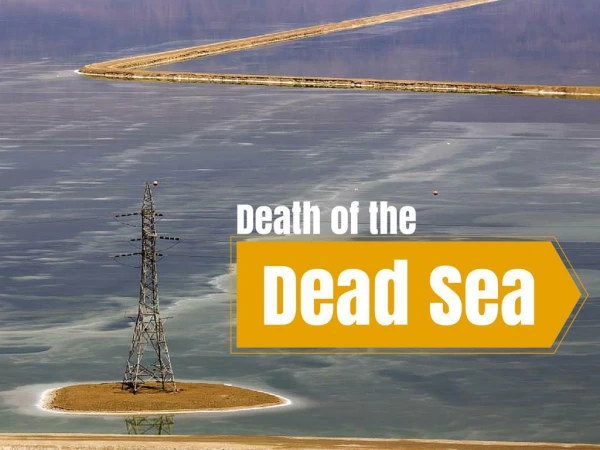
Evaporation Ponds • The evaporation ponds in the southern portion of the dead sea are responsible for the production of Sodium Chloride and Potassium salts. In recent years there has been an increase in the demand of these chemicals for the production of polyvinyl chloride (PVC). • Average depth of the these ponds are 4 meters. • http://upload.wikimedia.org/wikipedia/commons/4/4a/Dead_sea_ecological_disaster_1960_-_2007.gif
Red Sea – Dead Sea Canal • 1855 William Allen wanted to create a series of canals to channel water from the Mediterranean Sea to the Red Sea.
New and Improved Peace Conduit • Implication for: • Freshwater • Hydropower • Sea Level • Aquatic microorganisms • Chemical Composition • Precipitation of salts • Where do things stand now… Pending review.
Works Cited • Goetz, P.W. (ed.) The New Encyclopaedia Britannica (15th ed.). Vol. 3, p. 937. Chicago, 1986 • GavrieliIttai, Amos Bein, and Ahraron Oren. 2003. The Expected Impact of the Peace Conduit Project (The Red Sea – Dead Sea Pipeline) on The Dead Sea. Mitigation and Adaption Strategies for Global Change (2005) 10: 3-22. Springer. Print. • GavrieliIttai, LenskyNadav, Gazit-YaariNaama, Oren Aharon. The Impact of the proposed “Peace Conduit” on the Dead Sea. Evaluation of Current Knowledge on Dead Sea – Seawater Mixing. Report GSI/23/2002. The Ministry if National Infrastructure – Geological Survey of Israel. 2002. Jerusalem, Israel. Web. • Gertman, I. & A. Hecht. 2002. The Dead Sea Hydrography from 1992 to 2000. Journal of Marine Systems 35 (2002) 169-181. Print. • MotiTavassi, Sophia Barinova, and Hillel Glassman. Algal communities in the polluted lower Jordan River, Israel. Israel Journal of Plant Sciences Vol. 56 2008 pp. 111–119. • Nissenbaum, Arie. The Dead Sea - an economic resource for 10000 years. Weizmann Institute of Science. Hydrobiologia 261: 127-141, 1993. S. H. Hurlbert (ed,), Saline Lakes V. 0 1993 Kluwer Academic Publishers. Printed in Belgium. • http://ims.gov.il/IMS/CLIMATE/LongTermInfo • http://www.deadsea.co.il/index.php?page_id=1&lang_action=change_lang&to_lang=en&geo_action=done • http://www1.american.edu/TED/deadsea.htm • http://siteresources.worldbank.org/INTREDSEADEADSEA/Resources/ERM_Environmental_Scoping_Report_Dec2008.pdf • http://www.gsi.gov.il/Eng/_Uploads/79Peace_Cond.pdf • Israel Oceanographic & Limnological Research Israel Marine Data Center (ISRAMAR). 2011. <http://isramar.ocean.org.il/isramar2009/DeadSea/> Web.