Download
1 / 14
140 likes | 161 Vues
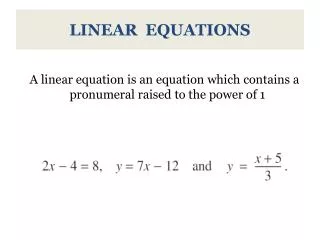
Dive into linear equations, linear plots, and recursive sequences in this comprehensive lesson. Learn vocabulary, create plots, identify quadrants, and master recursive routines. Engage with real-life scenarios and practice with examples.

E N D
Lesson 2.2 Core Focus onLinear Equations Linear Plots
Warm-Up Write the first five terms of each recursive sequence. • Start Value = 10 Operation = Add 6 • Start Value = 44 Operation = Subtract 5 • Start Value = 0 Operation = Add 10, 16, 22, 28, 34 44, 39, 34, 29, 24
Lesson 2.2 Linear Plots Create linear plots for recursive sequences.
Vocabulary The vertical axis is used for the variable y and is called the y-axis. Coordinate Plane Created by drawing two number lines which intersect at a 90 angle. Axes The horizontal and vertical number lines on a coordinate plane. Origin The point where the axes intersect. The coordinates of the origin are (0, 0). Quadrants Four regions formed by the x and y axes on a coordinate plane. Ordered Pair A pair of numbers used to locate a point on the coordinate plane, (x, y). x, y (7, 3) x-axis The horizontal axis is used for the variable x and is called the x-axis.
Good to Know! When real-life situations are examined mathematically you will find that many can be described as having a linear relationship. When graphed on a coordinate plane, a linear relationship looks like a straight line. The graph below shows the total money someone might spend at the state fair depending on the number of rides they go on. Linear relationships can also be shown using a table. The table above models the same information as the information displayed in the graph. The cost (y-coordinate) based on the number of rides can be described by a recursive routine.
Example 1 Describe the linear relationship given by the y-coordinates on the graph by stating the recursive routine and the first 10 numbers in the recursive sequence. a. The y-coordinates that are shown are 1, 4, 7, 10, 13, … The recursive routine can be described by the following rules: Start Value: 1 Operation: Add 3 Using this recursive routine you can determine the first 10 y-coordinates in this sequence are: 1, 4, 7, 10, 13, 16, 19, 22, 25, 28
Example 1 Continued… Describe the linear relationship given by the y-coordinates on the graph by stating the recursive routine and the first 10 numbers in the recursive sequence. b. The y-coordinates that are shown are 7, 2, –3, –8, … The recursive routine can be described by the following rules: Start Value: 7 Operation: Subtract 5 Using this recursive routine you can determine the first 10 y-coordinates in this sequence are: 7, 2, – 3, –8, –13, –18, –23, –28, –33, –38
Extra Example 1 Describe the linear relationship given by the y-coordinates on the graph. Make an input-output table of the ordered pairs on the scatter plot. SV = −1; operation = add 2
Good to Know! Sometimes it is useful to generate a table to represent the ordered pairs of recursive sequences shown on a linear plot. This can be done by creating an input-output table for the x- and y-coordinates. For example, the ordered pairs of part a in Example 1 can be converted to a table by recording each x-coordinate with its corresponding y-coordinate.
Example 2 Jerome throws the shot put for Newbridge High School. Coming into the season his personal best was 42 feet. Each week his shot put throws increase by 0.5 feet. Create a linear plot that represents this situation. Write a recursive routine to describe it.
Extra Example 2 Beatrice started her coin collection with five coins. Each day she added three coins. Create a scatter plot that represents this situation. Write a recursive routine to describe it. SV = 5; operation = add 3
Recursive Routines for Linear Relationships Start Value The y-value that corresponds to an x-value of 0. Operation The amount the y-value increases or decreases for each unit on the x-axis.
Communication Prompt Why might you want to show a recursive routine using different displays (input-output table, graphs, etc)?
Exit Problems Describe the linear relationship given by the y-coordinates on each graph. 1. 2. SV = 10, Operation = Subtract 2 SV = −3, Operation = Add 4