Download
1 / 22
220 likes | 326 Vues
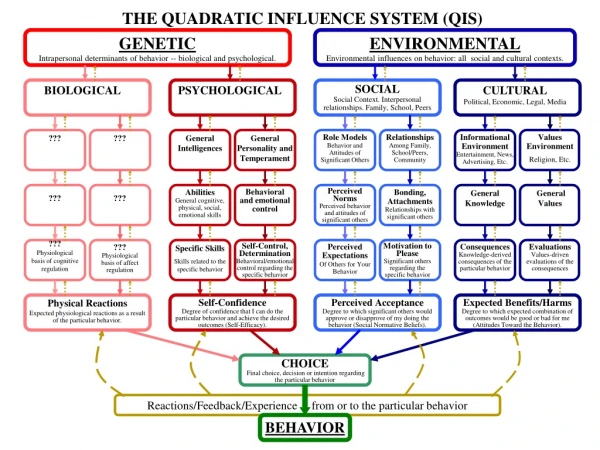
Linking Genetic Profiles to Biological Outcome. Paul Fogel Consultant, Paris S. Stanley Young National Institute of Statistical Sciences NISS, NMF Workshop February 23, ‘07. Scotch whiskey database. Original matrix. = Prototypical flavor patterns. X Mixing levels (weights). + Residual.

E N D
Linking Genetic Profiles to Biological Outcome Paul Fogel Consultant, Paris S. Stanley Young National Institute of Statistical Sciences NISS, NMF Workshop February 23, ‘07
Scotch whiskey database Original matrix = Prototypical flavor patterns X Mixing levels (weights) + Residual
How many flavor patterns? Profile likelihood (Zhu and Ghodsi) Scree plot Volume filled (Determinant)
AnCnoc Floral Sweetness Fruity Malty Nutty
Balmenach Winey Body Honey Sweetness Nutty Malty
GlenGarioch Spicy Fruity Sweetness Body Malty
Lagavulin & Laphroig Medicinal Smoky Body
Statistical Issues • Massive testing: Hundreds of “omic” predictors and several questions per sample. • Family-wise versus false discovery. • Missing data, outliers. Don’t fool yourself.
Matrix Factorization Methods • Principle component analysis. • Singular value decomposition. • Non-negative matrix factorization. • Independent component analysis. • Robust MF. Area of active research.
Key Papers • Good (1969) Technometrics – SVD. • Liu et al. (2003) PNAS – rSVD. • Lee and Seung (1999) Nature – NMF. • Kim and Tidor (2003) Genome Research. • Brunet et al. (2004) PNAS – Micro array. NMF commits one vector to each mechanism. SVD eigen vectors come from a composite of mechanisms.
NMF Algorithm Genes or Compounds Samples WH A Start with random elements in red and green. Optimize so that (aij – whij)2 is minimized. = + E Green are the “spectra”. Red are the “weights”.
Inference • Test each variable sequentially within an ordered set. Each set corresponds to a particular eigenvector, which has been ordered by decreasing values. Increase in statistical power. Genomic example. Simulation.
Micro Array Example • Group AML: patients with acute myeloid leukemia • Group ALL: patients with acute lymphoblastic leukemia • Subgroup ALL-T: T cell subtypes • Subgroup ALL-B: B cell subtypes Golub,T.R. et al. (1999) Molecular classification of cancer: class discovery and class prediction by gene expression monitoring. Science, 286, 531–537.
Clustering NMF clusters samples correctly. Brunet et al (2004). PNAS vol. 101 no. 12 4164–4169 Additional subgroup of ALL-B.
Clustering NMF clusters samples correctly. Additional subgroup of ALL-B. Brunet et al (2004). PNAS vol. 101 no. 12 4164–4169
Clustering NMF clusters samples correctly. Additional subgroup of ALL-B. Brunet et al (2004). PNAS vol. 101 no. 12 4164–4169
Sequential testing Immune Response 10 genes (p=0.00019) MHC class II 5 genes Cluster 1 ALL-B1 (33 genes) Proteasome 7 genes P = 0.00054 MHC class I & II 6 genes P = 0.00018 Immune Response 28 genes(p=0.00047) RNA Processing 11 genes P = 0.00260 Cluster 3 ALL-B2 (169 genes) DNA Repair and Replication 11 genes P = 0.01519 Cell Growth and Proliferation 61 genes Cell Cycle 12 genes Transcription 16 genes Upregulation in ALL-B2 genes Higher rate of transcription and replication processes More: Proliferative nature compared with ALL-B1 Proteasomal activity Energy production.
Simulation Genes 1-5: up-regulated by T1 Genes 6-10: up-regulated by T2 Genes 11-20: up-regulated by T1 and T2 Intragroup correlation structure
Simulation results Increased power Same level of FDR For more details see paper
Summary • The strategy is conceptually simple: • Non-negative matrix factorization is used to create groups of genes that are moving together in the dataset. • The error rate to be controlled is allocated over these groups. • Within each group, genes are tested sequentially. • The strategy should be effective if there are sets of genes moving together so that group formation reflects biological reality. Areas of research: Robust algorithms Speed Multiblock NMF (e.g. relate active motifs with differentially expressed genes)
Contact Information Paul Fogel paul.fogel@wanadoo.fr +33 1 43 26 16 86 Stan Young National Institute of Statistical Sciences young@niss.org 919 685 9328 www.niss.org/irMF Independent consultant Literature Software