Download
1 / 46
490 likes | 663 Vues
Lecture 4 Interest Rates and Interest Rate Determination. Key Interest Rates Federal Fund Rate The rate at which banks lend reserves to one another on an overnight basis. Important Points Key Federal Reserve Policy Variable Market Rate, not fixed Little Federal about it !

E N D
Lecture 4 Interest Rates and Interest Rate Determination
Key Interest Rates • Federal Fund Rate • The rate at which banks lend reserves to one another on an overnight basis. • Important Points • Key Federal Reserve Policy Variable • Market Rate, not fixed • Little Federal about it ! • Will disappear as policy variable as LIBOR proliferates.
Key Interest Rates • 2. Discount Rate • The rate at which the Fed lends reserves to banks and other financial institutions. • 3. 10 Year Treasury • Imputed Rate on 10 yr. Treasury notes or bonds (assumes reinvestment of coupons at this rate). • 3 mo Treasury • Discount rate on 91 day T-bills.
LIBOR is the most widely used benchmark or reference rate for short term interest rates. It is compiled by the British Bankers Association and released to the market at about 11:00 each day. LIBOR stands for the London Interbank Offered Rate and is the interest rate at which the banks borrow funds (US Dollars) from other banks in the London interbank market. • LIBOR is typically pretty close to the Fed Funds Rate but is well below the Prime Rate.
3 month LIBOR vs. PRIME Prime LIBOR Note: - Not substitute libor for prime - Must remember libor is variable rate prime is “fixed”
INTEREST RATE MECHANICS • Bond prices and interest rates move in opposite directions • • If bond prices rise, interest rates on those bonds fall. • • If bond prices fall, interest rates on those bonds rise. • Q. If interest rates equal 10%, what would you pay for a zero coupon bond that pays $100 one year from now? • About $91 (because your interest income would be $9 and $9/91 as about 10%). • If interest rates equal 1%, what would you pay for the same bond? • About $99 • So, Interest RatePrice • 10% $91 • 1% $99 • So What will drive bond prices up ? • Pension funds want bonds • Foreign investors want bonds
Another Way To See the Same Thing Suppose you have a 4% bond with Face Value $100 Coupon $4 If it sells for $100, its current return is 4% ($4/$100). Now suppose interest rates in the economy go up to 8%! Would someone pay you $100 for this bond? No, because if Price = $100 and coupon = $4, the return is 4%, not 8%. What would someone pay? About $96.00 because
Where Do We See This in the Real World? The yield on the 10-year Treasury note, a benchmark for corporate borrowing and home loans, soared to the highest in a year after Fed Chairmen Alan Greenspan in July testified before the House finance committee. Greenspan said conditions compelling the Fed to buy longer-term government debt in order to curb disinflation or buoy the economy “are most unlikely to arise”. (Wall Street Journal) This quote says that when the Fed announced it would not buy long-term bonds, the market said “Demand for the bond will not be there in the future” so its price will fall. Everyone then “got out” of 10 year bonds causing its price to fall and its return to rise.
Discount vs. Yield • Some money market instruments are quoted on a discount basis, (T-bills, commercial paper, bankers acceptances), others on a yield basis (government notes and bonds, corporate bonds, mortgage securities, etc). • Here is the difference. Suppose you pay $90 for one year T-bill that returns $100 face value in one year. • But the amount below face that the bill sold for (i.e. its Discount price) is
Recent Treasury Bill Auction Results Term Issue Maturity Discount Investment Price CUSIP Date Date Rate % Rate % Per $100 28-day 7-7-05 8-4-05 3.000 3.049 99.766 912795VK4 91-day 7/7/05 10/6/05 3.145 3.214 99.205 912795VU2 182-day 7/7/05 1/5/06 3.429 3.429 98.319 912705WH0 14-day 7/1/05 7/15/05 3.165 3.213 99.876 912795TN1 28-day 6/30/05 7/28/05 2.925 2.972 99.772 912795VJ7 91-day 6/30/05 9/29/05 3.080 3.147 99.221 912795VT5
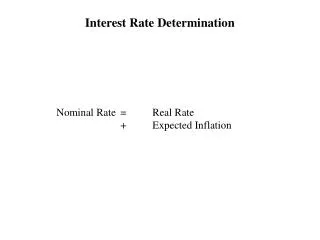
Nominal Returns vs. REAL Returns • • Nominal interest rate = real interest rate + expected inflation • where nominal rate is advertised market rate; • real rate is extra purchasing power lender demands of borrower.
Proof • In zero inflation world, if M&M’s cost $1.00 and you lend $10.00, you’re lending 10 bags of M&M’s • If you want a real return of 10%, you need 11 bags so you charge 10% interest and get $11.00 back • If inflation is 20%, then you need $1.20 x 11 = $13.20 back to buy 11 bags and get your 10% real return. This means you must charge a nominal rate of 32% • 32% = 10% + 20% + 2% • Nominal real expected • Rate = rate + inflation + real rate • inflation • Conclusion • Two fundamental determinants of interest rates are • • strength of economy • • expected (not past) inflation
The Fisher Effect with Taxes The real after tax purchasing power of a $1 investment (1 + rat) equals, by definition, my investment return after taxes divided by the new price of goods I purchase. Where PE is expected inflation
INTEREST RATE “FACTS” • Until recently (January 2003) the Discount Rate was usually below Fed Funds about 100 basis points or so. • Was always the best rate in town. • Now it is a penalty rate just like in European Banks. • Sometimes referred to as a Lombard facility.
2. Using “Open Market Operations” to change Fed Funds Rate Benchmark interest rate monitored by Federal Reserve Everyday Board of Governors informs New York Fed what Fed Funds should trade at. At about 9:30 each day, New York Fed intervenes to set rates at the target level. To raise Fed Funds rate, Fed must reduce amount of reserves in banking system so that banks have to pay more to borrow.
To raise rates, Fed sells Treasury Bills to government securities dealers. Dealer writes check to Fed drawn on a bank. Dealer’s bank now owes Fed $. Fed just takes it out of the banks reserves. To lower the Fed Funds rate, Fed buys Bills from Securities dealers. It writes a check on itself which gets deposited in a bank. Bank sends check back to Fed to get $. Bank reserves rise, interbank borrowing is easier and rates fall.
Key Concern Retail sweep decreased bank reserves OMO can make Fed Funds volatile New proposal to pay interest on reserves to keep reserve levels higher.
Yield curve spread: the difference between the 10 year Treasury Yield and 3 Month Treasury Discount. • Treasury Yield Curve
A. Typically low right before a recession • Boom raises short term real rates. • Inflation has raised short rates. • Higher short term rates kill consumer demand. B. Primary reason spread widens in recession • Slowdown in economic activity depresses short term rate. • Investors expect interest rates to go up again when economy recovers so longer term rates are higher.
TWO POINTS ON YIELD CURVE SPREAD 1. You can use (somewhat reliably) the spread to forecast recessions. NOTE: Spread low before recession 1) Short term rates high as Fed slows economy. 2) Long term rates low because markets see recession.
2. But, we must note that the spread can fall either because short rates rise, or long rates fall. If the former (i.e. short rates rise), then falling spread reliably forecasts recession because borrowing cost increase means less borrowing, fewer car loans, fewer cars, etc. But, if the latter (i.e. falling long rates) it is much less clear. NOTE: Longer term rates can fall (thus narrowing the spread) because of good things - inflation has been reduced permanently. - government is borrowing less to finance deficits.
The Yield Curve as a Predictor of U.S. Recessions Arturo Estrella and Frederic S. Mishkin Estimated Recession Probabilities for Probit Model Using the Yield Curve Spread Four Quarters Ahead Recession Probability Value of Spread (Percent) (Percentage Points) 5 1.21 10 0.76 15 0.46 20 0.22 25 0.02 30 -0.17 40 -0.50 50 -0.82 60 -1.13 70 -1.46 80 -1.85 90 -2.40 Federal Reserve Bank of New York Current Issues in Economics and Finance, June 1996, Vol. 2, No. 7
Long Rates Drop Because “inflation” is Dead ! Long rates drop because of Treasury refinancing and increased demand for Long-term govt’s.
3. Impact of Foreign Investors. Without them bidding for our debt, interest rates would be higher. When will they bid more? When value of dollar is expected to rise. So a strong dollar lowers interest rates, all else fixed.
4. Why would Fed fear inflation? inflation would raise interest rates and stall recovery. inflation would raise interest rates and hurt stock market. inflation would raise interest rates and raise government deficit. 50’s 60’s 70’s 80’s 90’s
5. Why would Fed fear deflation? Since i = r + expected inflation, with r = 2% or 3%, deflation of 4% or more would cause normal rates to be negative ! How would loan markets then work ? If you have deflation, debtors are in big trouble. They have to work harder to pay off loans. Suppose you owe me $100 and you sell computers for $100 each. You only have to make 1 computer to pay me back. But if computers sell for $1 each, you now have to make 100 computers to pay me back ! Much more difficult, if not impossible. If deflation is persistent, people will all wait to buy things (i.e. wait for the lowest price), which means economy will stall.
6. Pegging "Real" Rates. The Fed’s Current Policy? Idea is that higher real rates slow the economy, lower real rates bolster the economy. So to slow it down, Fed raises real rates.
In place of the money supply, … Greenspan indicated he’s putting greater reliance on “real” short term rates…”
“because the ‘real’ federal funds rate, i.e. adjusted for inflation would still be positive and above its typical level.
7. Money and Interest Rates • Liquidity effect: think of it one of these ways. 1. If something is plentiful, its price drops. So, the more money is around, the lower is the interest rate, or 2. When bank find money plentiful, they lower interest rates to get rid of it, or 3. To increase money, Fed buys Government Securities by “printing” money. When demand for Securities rises, price of securities rise. When price of a security rises, its return (interest rate) falls.
• Fisher Effect: creating to much money causes more money chasing some amount of goods. So, price of goods goes up. But if price increases cause inflation, interest rates will rise! More on this later… • So, Money Inflation Interest Rates • This is why high money growth in the 60’s/70’s led to higher, not lower, interest rates. • This also explains why Greenspan was reluctant to create too much money in late 1990’s. • He felt it would just cause inflation and higher (not lower) interest rates. • Fisher Equation : i = real rate + expected inflation
LEARNED… • Nominal rates = real rates + expected inflation. • That interest rates, especially the Real Fed Funds Rate, has become the focus of monetary policy. • That the Fed is now running countercyclical policy, i.e. if the Economy heats up, they raise real rates. • That this countercyclical policy is why old relationships between unemployment + Cap Util + inflation don’t work as well today. • That the focus is so much on rates, that some economists just use yield curve spreads to forecast economic activity, but this can be wrong. • That when money grows to fast all you get is higher inflation + higher rates since I = real + exp.infl. • Higher interest rates raise cost of financing government deficits and decrease stock/bond prices.