Download
1 / 5
50 likes | 110 Vues
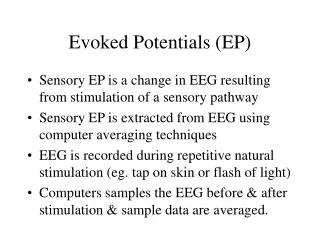
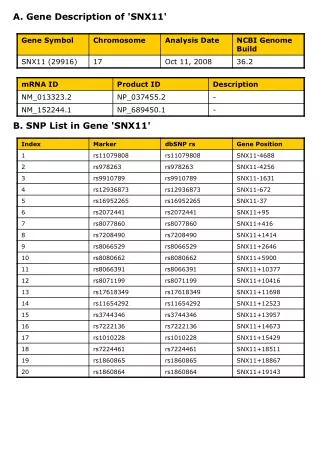
A seemingly complete description of evoked responses. Somatosensory stimulation: ascending ST volley SPM maps at the level of the cuneate nucleus derived from ST MFT solutions: yellow p <0.00001 red p <0.0000001.

E N D
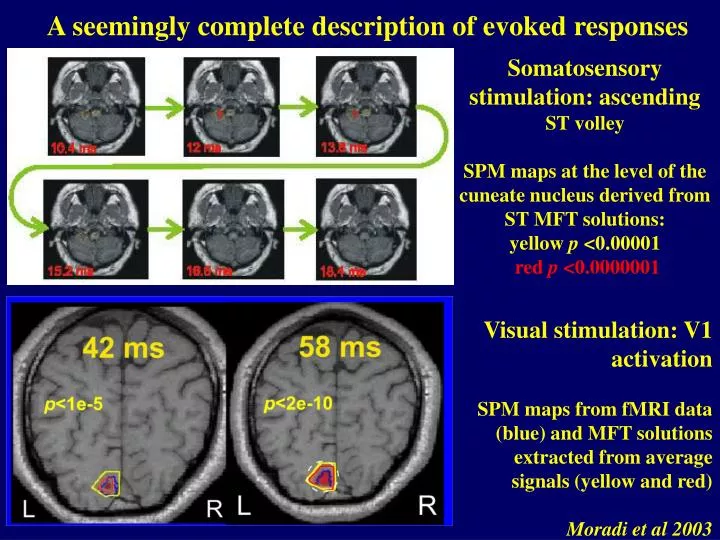
A seemingly complete description of evoked responses Somatosensory stimulation: ascending ST volleySPM maps at the level of the cuneate nucleus derived from ST MFT solutions: yellow p <0.00001red p <0.0000001 Visual stimulation: V1 activationSPM maps from fMRI data (blue) and MFT solutions extracted from average signals (yellow and red)Moradi et al 2003
Average and (3) prototypes of ST responses to a simple median somatosensory stimulation The timelocked response is a minute fraction of the local ongoing activity, as shown by the animation of a single trial of visually evoked V1 response from a 3 cpd Lower Left visual field stimulus 20 times slower than real time
Average and single trial responses: Semantic geodesic maps for auditory responses The average or ST evoked response can be visualized using graph theoretic ideas. The trajectory of the average response or that of each prototype is visualized using embedding in the “main space”. Top: From the ensemble average response Middle: From sub-averages of each group Bottom: From individual single trials Unification of pattern analysis and non-linear timeseries analysis Laskaris & Ioannides, Clin. Neurophysiol. 113:1209-1226 (2002)
The average signal is dominated by reorganization of ongoing activity in polymodal areas, depending on their state before stimulus onset. Activity in polymodal areas is functionally coupled with regional responses, e.g. in V1. Laskaris, Liu and Ioannides (2003), NeuroImage 20:765-783 ]
Brain oscillations and perturbed states The morning session will emphasize empirical results: • Scott Makeig will elaborate and show his latest results on the question of evoked responses vs perturbed ongoing dynamics • Olivier Bertrand link observations on oscillatory networks in humans from intracranial and scalp EEG/MEG data While the afternoon session will emphasize methodology: • Piotr Durka will advocate the use of adaptive time frequency approximations of signals for explicit parametrization of signals and universal robustness • Finally Olaf Sporns will introduce graph evolution as a computational tool that can reveal relationships between seemingly unconnected fundamental properties of networks