Download
1 / 23
230 likes | 412 Vues
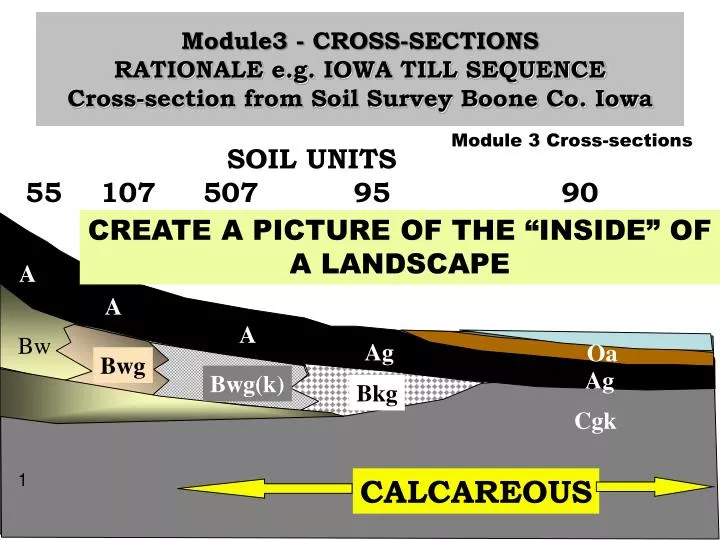
Module3 - CROSS-SECTIONS RATIONALE e.g. IOWA TILL SEQUENCE Cross-section from Soil Survey Boone Co. Iowa. Module 3 Cross-sections. SOIL UNITS 55 107 507 95 90. CREATE A PICTURE OF THE “INSIDE” OF A LANDSCAPE. A. A. A. Bw. Ag. Oa. Bwg. Ag. Bwg(k).

E N D
Module3 - CROSS-SECTIONSRATIONALE e.g. IOWA TILL SEQUENCECross-section from Soil Survey Boone Co. Iowa Module 3 Cross-sections SOIL UNITS 55 107 507 95 90 CREATE A PICTURE OF THE “INSIDE” OF A LANDSCAPE A A A Bw Ag Oa Bwg Ag Bwg(k) Bkg Cgk 1 CALCAREOUS
Objective: The PARTICIPANT will create cross-sections by profiling topographic maps and estimation from landscape sketching and from topographic estimations. 2
Objective: The participant will create cross-sectional soil or stratigraphic diagrams such that two dimensional spatial conditions are illustrated. ET-VAPOR LOSS A Bk Btg UNSATURATED FLOW-CaCO3 PRECIPITATION. SATURATED FLOW-LEACHING & TRANSLOCATION EVAPORATIVE DISCHARGE C RECHARGE 3 Opened a pit and sketched. Knuteson et al. 1989
“FENCE” CROSS-SECTION SOIL PROFILES AS FROM AUGER OR GIDDINGS TUBES Salinization Reduction A A A Bw A Bkyzg Bk Cg C C Cg Steinwand and Richardson 1989 4
“FENCE” CROSS-SECTION ADD HYDROLOGY TO DIAGRAM Leaching Salinization Reduction A A A Bw A Bkyzg Bk Cg C C Cg 5
CROSS-SECTION in NDSUMMER AND FALL MAKE THE DIAGRAM CONTINOUS Leaching Salinization Reduction Bw Bk Bw Bkyzg Bk Bkyzg GEOMORPHOLOGY STRATIGRAPHY PEDOLOGY HYDROLOGY C C Cg 5
A’ A 6
Step 1. Add slope Profile a. on topographic map marked where major contours were (on flatter areas may have used minor also). b. On paper (or computer screen) draw down to some base elevation Water 1400 1350 CONTOUR INTERVAL (ci) FOUND BY LINES BETWEEN BOLD ELEVATIONS (5). BOLD ELEVATIONS 50 FEET. CI = 10 FEET. 1300’ 1250’ 1200’ 8
Step 1. Add slope Profile Step 2.a. Added Green dotted line from topog 2b. Added green line from WSS – Till and Loess above and shale below (Kloten soil). 2b. Added green line from WSS – Till and Loess above and shale below (Kloten soil). Water Barnes-Temvik From WSS and Topog. 83 Added two lines Kloten (shale) On both the topog sheet and the WSS Could see an area with back-rotation (top of a landslide). Asummed from the soils That till and loess above and “83 F Buse-Kloten That somewhere till ends and shale (Kloten) Starts. Read that in soil survey report and OSD. Added dashed green line to show steep head scarp Of landslide – see Handy’s illustration. Would you build a house to see the view here?! S. River 9
Step 1. Add slope Profile Step 2.a. Added Green dotted line from topog 2b. Added green line from WSS – Till and Loess above and shale below (Kloten soil). Water Su From WSS and Topog. Added two lines Bs 3. ADD ESTIMATED HYDROLOGY Blue lines 4. Add landslide fractures Black lines S. River FS TS 10
JLR DREW THIS SKETCH BY LOOKING A TOPOGRAPHIC MAP AND SIMPLY “EYEBALLING IT” From the above – one can squeeze to and vertical/horizontal ratio one wants. 11
Objective: Understand how ArcGIS can be used to create slope profiles from DEMs
Use the 3D Analyst Extension Use the “Interpolate Line” icon to draw a slope transect. Note: “Profile graph” icon is grayed out. Note that soils (green) change down the hillslope.
“Profile graph” icon is no longer grayed out. Line is drawn and selected.
Click the “Profile graph” icon, and you get… Rt-click to adjust graph properties
Here’s one version. LOTS of options… colors, styles, etc Unfortunately, I don’t see any automatic options for showing overlain data (e.g., soil lines, sample points, etc.).
Elevations taken from SSURGO (manually, w Identify button). Lines, text added to profile in Power Point. Loess (fi-si) 308 Paleosol in till (aquitard!) Loess (fi-si) 305 Till 303 Till 298 Footslope (colluvial material) 295 Note asymmetry in stratigraphy across the valley: Aspect (N/S) differences? Or, mapping/compilation inaccuracies?
DEM resolution will affect profile. More detail – but is it “better”? Some contour line bias evident Noise from cultural features evident
PARTICIPANTS willdraw a cross-section and apply the three soils to the landscape • 1. Develop a Cross-section • 2. Place the stratigraphic line for the 2 parent materials. (loess has a higher Ksat than till). • 3. Place the three mapping units on the landscape and use “MOST IMPORTANT LINES” idea • 4. Add the hydrology. • 5. Can you explain the soil horizons?
THREE SOILS ON THE LANDSCAPE Loess(2) Till(6) Loess and Till(9) 10” 25cm Bt Btg Btg 20” 50cm Bt 30” 75cm 40” 100cm 50” 125cm Btg