Download
1 / 38
390 likes | 540 Vues
HURRICANE OBSERVATIONS. Dr. Richard M. Yablonsky (URI/GSO) HSS Teacher’s Institute Presentation URI Coastal Institute, Narragansett, RI Tuesday, 27 July 2010 at 10:00 AM. Hurricane Forecasting. Numerical Modeling. Dissemination. Data Acquisition And Processing. Warnings Operations.

E N D
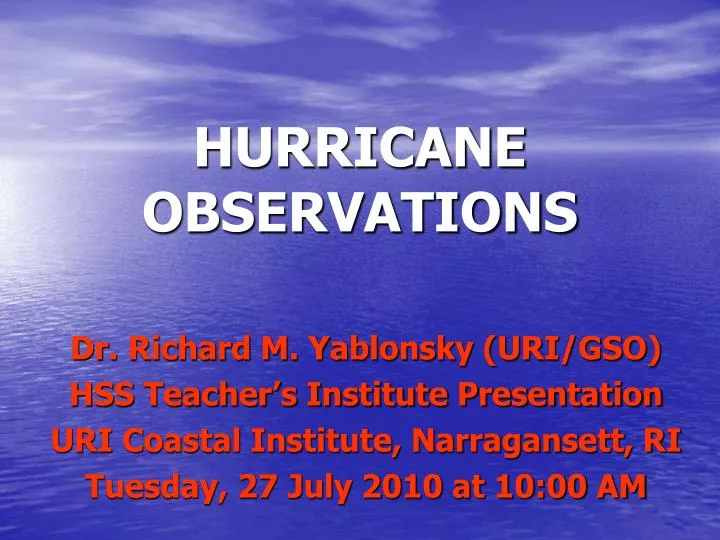
HURRICANE OBSERVATIONS Dr. Richard M. Yablonsky (URI/GSO) HSS Teacher’s Institute Presentation URI Coastal Institute, Narragansett, RI Tuesday, 27 July 2010 at 10:00 AM
Hurricane Forecasting Numerical Modeling Dissemination Data Acquisition And Processing Warnings Operations Response
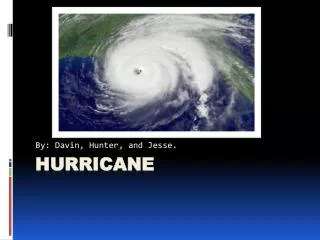
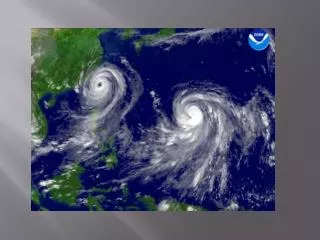
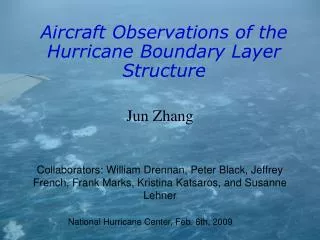
Before we can predict what a storm will do in the future, we need to know what the storm, the atmosphere, and the ocean look like right now! Radiosondes: Instruments attached to weather balloons that transmit temperature, humidity, & wind data back to the ground. These balloons are launched globally twice a day. Aircraft:Commercial aircraft regularly report weather data. NOAA “Hurricane Hunter” aircraft penetrate hurricanes to gather valuable data on the storm. Satellites:Gather data on clouds, water vapor, and land & sea surface temperatures. Observational Tools Surface:Thousands of weather stations across the globe report weather conditions every hour. View from a Hurricane Hunter aircraft inside the eye of category 5 Hurricane Isabel Two NOAA P3 “Hurricane Hunter” aircraft Weather satellite
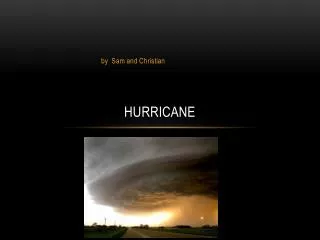
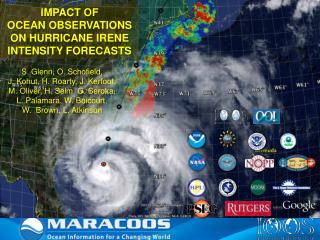
Hurricane Ivan on September 9, 2004 A thunderstorm in one of Ivan’s spiral bands ~ 250 miles Image courtesy of NOAA/
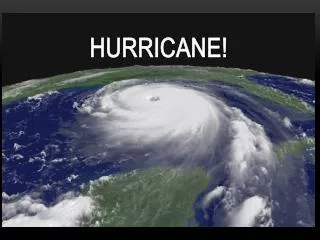
Hurricane Frances (2004) Image courtesy of CIMMS / Univ of Wisconsin
National Hurricane Center(Miami, FL) http://www.nhc.noaa.gov
Ocean’s Role in Hurricane Intensity Satellite Infrared Image of Sea Surface Temperature Hurricane Gert (1999)
Dropwindsonde Instrument “Pringles cans with microprocessors and parachutes”
US Navy’s MV Cape Vincent:Part of Voluntary Observing Ship (VOS) Program
NOAA Buoy 42003 in Katrina (2005) Dominant Wave Period meters seconds Significant Wave Height
Charley (2004): Doppler Radar Reflectivity and Radial Velocity • http://atoc.colorado.edu/~cassano/weather/charley/radar/tbw_ref/radar.html • http://atoc.colorado.edu/~cassano/weather/charley/radar/tbw_vel/radar.html
Ground-based weather stations:ASOS/AWOS, WeatherFlow, Mobile, Etc.