Download
1 / 5
50 likes | 166 Vues
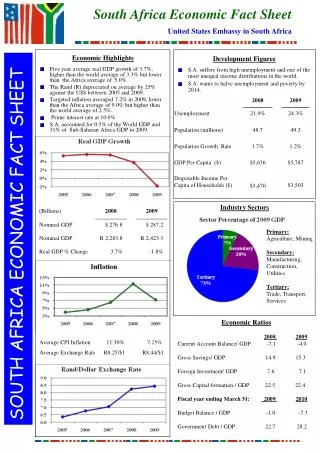
Deaths Due to Child Abuse and Neglect, as Reported by the Oklahoma Department of Human Services 1978-2006. Prepared by the Community Service Council of Tulsa for the Metropolitan Human Services Commission in Tulsa, June 2007. Data and preference for use of “Three Year Rolling Average”.

E N D
Deaths Due to Child Abuse and Neglect, as Reported by the Oklahoma Department of Human Services1978-2006 Prepared by the Community Service Council of Tulsa for the Metropolitan Human Services Commission in Tulsa, June 2007
Data and preference for use of “Three Year Rolling Average” The following graphs use two types of numbers: • Actual count for a year; • Rolling three year average of the child abuse and neglect data is used to provide a better view of the overall trend over time. • Rolling or moving average Using a rolling average smoothes out the high and low fluctuations of a measured variable and gives you a better view of the overall trend. This type of averaging aids in "normalizing," or "flattening," the presentation of the metric for evaluation purposes. When reviewing data on births and deaths, it is important to use this method, since they are one time events. It is also used when you are examining smaller geographic areas, such as counties, rather that the state as a whole. A rolling three-year average for the child abuse and neglect data shown in this presentation is calculated by dividing the total number of reports, cases, etc. for the previous three years Example: Rolling 3 year average for the number of child deaths due abuse or neglect for 1980 # of deaths for 1978 + 1979 + 1980 / 3 = 1980 three year rolling average For 1981 # of deaths for 1979 + 1980 + 1981 / 3 = 1918 three year rolling average The same procedure is used for each subsequent year. Source: OKDHS Annual Report and “Child Abuse & Neglect Statistics Fiscal Years 2000, 2001, 2002, 2003, 2004, & 2005,” OKDHS, Division of Children and Family Services Prepared by the Community Service Council of Tulsa for the Metropolitan Human Services Commission in Tulsa, June 2007 - File: Deaths Due CAN OK 1978-present.ppt
OklahomaDeaths due to Child Abuse or Neglect1980-2006Actual count Source: OKDHS Annual Report and “Child Abuse & Neglect Statistics Fiscal Years 2000, 2001, 2002, 2003, 2004, & 2005,” OKDHS, Division of Children and Family Services Prepared by the Community Service Council of Tulsa for the Metropolitan Human Services Commission in Tulsa, June 2007 - File: Deaths Due CAN OK 1978-present.ppt
OklahomaDeaths due to Child Abuse or Neglect1980-20063 Year Rolling Average Source: OKDHS Annual Report and “Child Abuse & Neglect Statistics Fiscal Years 2000, 2001, 2002, 2003, 2004, & 2005,” OKDHS, Division of Children and Family Services Prepared by the Community Service Council of Tulsa for the Metropolitan Human Services Commission in Tulsa, June 2007 - File: Deaths Due CAN OK 1978-present.ppt
Child Death Table for data presented on previous pages Source: OKDHS Annual Report and “Child Abuse & Neglect Statistics Fiscal Years 2000, 2001, 2002, 2003, 2004, & 2005,” OKDHS, Division of Children and Family Services Prepared by the Community Service Council of Tulsa for the Metropolitan Human Services Commission in Tulsa, June 2007 - File: Deaths Due CAN OK 1978-present.ppt