Download
1 / 40
410 likes | 640 Vues
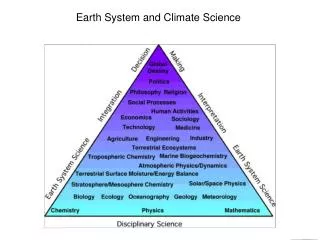
REGIONAL CLIMATE CHANGE OVER INDIA and Importance of High Resolution Climate Modeling to Impact Assessments. Dr. Vidyunmala Veldore Earth Science and Climate change Division The Energy and Resources Institute, New Delhi. Centre for Global Environmental Research Division at TERI.

E N D
REGIONAL CLIMATE CHANGE OVER INDIA and Importance of High Resolution Climate Modeling to Impact Assessments Dr. Vidyunmala Veldore Earth Science and Climate change Division The Energy and Resources Institute, New Delhi
Centre for Global Environmental Research Division at TERI Socio-economic scenario generation and policy making Impacts, Adaptation and Vulnerability Assessments and links to policy Clean Development Mechanism and Carbon Market studies in Asia Climate Modeling and Research
Climate Change Science Research The IPCC Sequence of Key Findings…… IPCC (1990) Broad overview of climate change science, discussion of uncertainties and evidence for warming. IPCC (1995) “The balance of evidence suggests a discernible human influence on global climate.” IPCC (2001) “Most of the warming of the past 50 years is likely (>66%) to be attributable to human activities.” IPCC (2007) “Warming is unequivocal, and most of the warming of the past 50 years is very likely (90%) due to increases in greenhouse gases.”
Need of Climate Change Science Research … • Climate change (GW) is global in nature, however, the impacts vary at regional scale • India is highly vulnerable to climate change due to its diversified socio-economic profile and heterogeneous climatic regimes, including a long coastal area • There is a need to build institutional capabilities to address these issues; not only related to regional scales but also to the global scale
… Need of Climate Change Science Research • It also includes concerns to quantify sectoral impacts assessments of vital sectors like agriculture, water resources and health, for effective policies • The existing state-of-art general circulation models are yet to be fine tuned to address the complexities of Indian summer monsoon before they can be used for reliable monsoon predictions, climate change projections and regional impacts assessment studies
IPCC Model performance over SAS region Temperature bias % precipitation bias Season Min 25 50 75 Max Min 25 50 75 Max DJF -7.4 -4.0 -2.6 -1.6 1.9 -27 0 30 59 127 MAM -5.6 -1.9 -0.7 -0.4 2.5 -44 -26 -1 13 72 JJA -2.9 -1.3 -0.1 0.6 1.9 -70 -25 -14 5 29 SON -5.2 -3.2 -2.1 -0.9 2.6 -26 -12 -2 14 42 ANN -4.8 -2.4 -1.4 -0.8 2.2 -49 -16 -10 5 33 IPCC’s multi-model bias estimates over South Asian region (Region 23) - AR4 1980-1999; wrt CRUTv2 1980-1999; wrt CMAP The model mean bias in temperature and rainfall over South Asian region, light violet color indicates that most of the models have similar bias( negative bias)
A 4-5mm/day of error in Rainfall over Indian land region between IMD and models/reanalysis
An error of 8-10oC in Maximum Temperature between IMD and models/reanalysis.
Seasonal variation of rainfall over Indian monsoon region in IPCC models
Key Discussion Points • Need for improved climate models over India • Improved monsoon predictions • Spatial and temporal variability of different teleconnection processes and their interaction with the atmospheric processes over the Indian region. • High resolution regional climate projections over Indian region which can provide both magnitude, intensity and variability over the Indian region similar to observations.
Glimpses of Completed/Ongoing projects Ongoing: Enhancing the climate modeling capabilities in India (BCCR-TERI) Coastal Vulnerability Assessment over the West Bengal State using Multi-Hazard Mapping (TERI-Govt of West Bengal) Assessing Vulnerable regions in state of Maharashtra using cross-sectoral Impact Assessment (TERI-Govt of Maharashtra-UKMO). Completed Impacts :of Severe Climate Change over North Indian region (TERI-ORNL) Integrated Assessments of Impacts and Vulnerabilities over the North-Indian region (TERI-Govt of India).
TERI Study with ORNL on Impacts of severe Climate change over North India region To analyze potential impacts of severe climate change scenario over North Indian using fossil fuel intensive scenario A1fi and to link these impacts with the socio-economic scenarios developed for the country at state scales using population and demand projections at the state level. • Objective of the work • Validation of CCSM3 • Methodology to calculate extreme events • Determination of severity of cyclones • Methods to estimate snow melt over the Himalayan region Climate Change Projections over India from CCSM3 at 150 km resolution Qualitative linkages to find the hotspots due to climate change and the socio-economic drivers and best strategies for the North Indian states to follow Socio-economic scenario generation using demographic and economic details of the state for the different narrative storylines. Impacts on water, agricultural demand, health infrastructure demand etc., for the four different scenarios
Methodology to estimate extreme events simulated by the Model Definition of Temperature Indices ETR: Extreme temperature range is the difference between maximum of Tmax and minimum of Tmin. Tn90p: Warm nights percent with respect to 90th percentile of reference period. The percentage of time where Tmin > Tmin90p TX90p: Very warm days percent wrt 90th percentile of referenceThe percentage of time where Tmax > Tmax at 90th percentile. TX10p: Very cold days percent wrt 10th percentile of referenceThe percentage of time where Tmax > Tmax at 10th percentile. Tn10p: Cold nights percent with respect to 10th percentile of reference period. The percentage of time where Tmin > Tmin10p
Trends in Extreme Temperature events over North Indian region in A1fi
Methodology to estimate extreme events in Rainfall Definition of Rainfall Indices R95p Very wet days wrt 95th percentile of reference period. The percentage of wet days with rainfall > rainfall at 95th percentile. R90p Wet days wrt 90th percentile of reference period. The percentage of wet days with rainfall > rainfall at 90th percentile. R75p Moderate wet days wrt to 75th percentile of reference period. The percentage of wet days with rainfall > rainfall at 75th percentile. CWD Consecutive Wet Days index per time period. The largest number of consecutive days where RR is at least 1mm. Also, another variable is the number of wet periods more than 5 days.
Extremes in rainfall using the observations and GCM: The rainfall is over estimated over the Rajasthan and Madhya Pradesh states and the magnitude and variance of rainfall indices are found to be low in models when compared to IMD
Vmax=14.2 * Determination of Cyclone tracks from the Climate Model using Empirical Approach valid over Bay of Bengal
Increase in Maximum Temperature over the Eastern Himalayan region and their link to snow total
Socio-Economic scenarios over the 11 North Indian states for four different narrative storylines:
Findings of the TERI-ORNL Study • The extreme events are showing increasing trend over the North Indian region with maximum changes in the Uttaranchal and Upper Ganges regions. • The frequency and intensity of cyclones also show an increasing trend in A1fi scenario with respect to baseline. • The snowmelt-maximum temperature relationship over the Eastern Himalayan region suggests that there is a possibility of decrease in snowmelt with increasing maximum temperature over this region. • The qualitative linkages show that since the North Indian states considered in the study are dependent on the agriculture as the main economy it is best suited to follow a sustainable path than the market oriented paths.
Second National Communication to UNFCCC from Government of India • Objectives • Integrated assessment of impacts and vulnerabilities in the North Eastern Region (NER) of India on forests resources and associated livelihoods and development of an adaptation framework • Assessment of current vulnerabilities in the region due to climate change and other pressures in the short to medium and long term timescales (2030s, 2050s and 2080s). • To develop a priority matrix of adaptation options along with an assessment of capacity for adaptation.
GIS Platform Social agents of change- proximity of roads and settlements Layer of forest change/no change for 2030, 2050, 2080 Integrated maps with vulnerable regions Topographic agents of change- proximity to water, elevation, slope, and aspect ` Layer of precipitation trends in 2030, 2050, 2080 Projected indicators of adaptive capacity for 2030,2050,2080 A Priority Matrix Identification of vulnerable regions Identification of appropriate adaptation options AF FA F Dependence on ecosystem services for livelihood and other purposes Adaptive capacity to cope with changes in future Qualitative analysis
Temperature Projections over the region The increase in temperature over the North-eastern region shows that the increase occurs uniformly over different time periods.
Land-use projections For projected Land use cover for 2030/50/80 the independent variables considered are s: (i) social agents of change namely proximity to road, and proximity to settlement, (ii) topographic agents of change namely proximity to water, elevation, slope, aspect and dependent variable the change in the forest cover and land use in past a decade (1999-2009).
Results • Regions with multiple stresses are then identified as case studies. • Arunachal Pradesh, Nagaland, Meghalaya, Mizoram states are found as highly stressed states. • The case studies for these regions are then considered, using both climatic and land-use land cover change.
Key Findings of the study: • The PRECIS model results of A1B scenario over the North Eastern region shows that : • The annual mean rainfall and the annual mean surface temperature both averaged over the NER are found to increase from 2030 to 2080 as compared to the baseline period. • The annual mean rainfall shows a decrease of 14% over Sikkim, Arunachal Pradesh and northern Assam in 2030s and 2050s with a moderate increase12% in 2080s. Whereas, there is an increase in rainfall of above 15% in the states of Tripura, Mizoram, Nagaland, Meghalaya and Manipur in all the time periods of future (2030s, 2050s and 2080s) with respect to baseline. • Maximum variance is shown in the Meghalaya region in the baseline as well as 2030s. However, the variance further expands to Manipur and Arunachal Pradesh in 2080s. • The integration of climate change and land-use changes over the region shows that the robustness of changes, where the extreme changes in rainfall occurs, these regions are also vulnerable due to maximum land-use changes.
Study Domain Coastal Vulnerability Assessment using Regional Climate and Impact Assessment Model over West Bengal - Ongoing Objective: To address the coastal vulnerability over West Bengal region using multi-hazard mapping and policy recommendations to the state Government. Regional Climate Model projections over the West Bengal region using PRECIS for 50km x 50km scale Impact Assessments of sea level rise, storm surge, water, agriculture and health sectors Determination of hotspots and multi-hazard mapping in GIS platform including socio-economic projections Policy Recommendations
Complex topography and importance of coastal impacts over this region
Cyclone Detection using an Empirical Approach • Parameters considered to measure the Intensity of Cyclone • Minimum Sea Level Pressure (MSLP) at the storm center • 2. Maximum Wind Speed • 3. No of closed Isobars on surface Based on 35 observational mean sea level pressure and corresponding maximum wind has been analyzed by Mishra & Gupta (1977). The best fit relationship between the minimum sea level pressure (mb) and the maximum sustained wind speed (knots) in storms occurring in Indian oceans suggest following empirical relation Vmax = 14.2 Vmax is in knots, Pn MSLP at outer periphery, Po MSLP at center of the storm.
Frequency and intensity of cyclones Table 1 Frequency and intensity of cyclone during 1961-1990 in BoB as simulated by PRECIS (50X50km resolution) Frequency of observed cyclone and severe cyclone (1877-1998) is more in May compare to June (Singh 2001, current science)
Table 2. Frequency and intensity of cyclone in A2 scenario (2071-2100) in BoB as simulated by PRECIS (50X50km resolution) The intensity and frequency of cyclone is likely to increase in future (IPCC 2007). Comparison of table1 & 2 shows more intense cyclones in A2 scenario and in June month.
Determination of Storm surge impact over the West Bengal coast • ADCIRC (ADvanced CIRCulation) is a finite element hydrodynamic model that solves the generalized form of the wave continuity equation for elevation and the non-conservative momentum equation for the velocity field. • The model is used for • Predicting surges due to hurricanes and other storms • Producing tidal charts for coastal areas • Studying general circulation patterns in near-shore and oceanic waters. • The model was originally developed for the U.S. Army Corps of Engineers over 18 years ago, by R. Luettich and J.J. Westerink, and has been modified by many others since then
ADCIRC Model Domain GEBCO 30 arc sec (~900M)
Model Output with Storm surge GEBCO 1min(~1.8Km) At Coast 1Km At Ocean Boundary 3Km
Way forward for this Project • To create a multi-hazard mapping using climate exposures with the help of extremes in rainfall and temperature and also due to cyclones and storm surges over the region. The map will also include social stress and economic stresses experienced over the region. • Locating the hotspots of vulnerability and case studies over this region using both local and government stakeholder consultations. • Adaptation and policy recommendations to be prescribed to the state government.