Download
1 / 31
310 likes | 393 Vues
Leaves to Landscapes: Using high performance computing to assess patch-scale forest response to regional temperature and trace gas gradients. George Host & Kyle Roskoski Natural Resources Research Institute Harlan Stech , Kathryn Lenz, Richard Mather & Michael Donahue

E N D
Leaves to Landscapes:Using high performance computing to assesspatch-scale forest response to regional temperature and trace gas gradients George Host & Kyle Roskoski Natural Resources Research Institute Harlan Stech , Kathryn Lenz, Richard Mather & Michael Donahue Department of Mathematics and Statistics University of Minnesota Duluth 5th International Workshop on Functional-Structural Plant Models Napier, New Zealand
Overview • Model overview • FACE site/ photosynthesis modeling • Patch-scale modeling strategy & sensitivity analyses • Application of model to regional ozone patterns
ECOPHYS – Process model for Populus • Genus Populus • P. eugenei (deltoides x nigra) and other hybrid poplar clones • Grown for fiber and energy production (1987) • P. tremuloides – Trembling Aspen • Most widespread and economically important species in eastern United States • Focus on global change response (1997) 2 yr old poplar plantation in Minnesota, USA
ECOPHYS – Individual-based Object-oriented model • Explicit spatial location of leaves • Hourly time step • PAR, Temperature, CO2, Ozone PSYN • Growth based on photosynthate production distributed throughout tree via carbon allocation model
ECOPHYS Modeling Primitives Leaf Object • Morphometric information • size, shape, thickness • biomass • location in 3d space • Physiological information • photosynthetic parameters • Farquhar et al • stomatal conductance • age, LPI • Process information • light-CO2 response function • ozone response • carbon allocation coefficients • leaf growth function • probability of abscission Internode Object • Morphometric information • length, diameter • weight • position on tree • Physiological information • density • carbon storage • Process information • carbon allocation patterns for green stems and older wood • Branch Object • Autonomous physiological units • Probabilistic branch drop algorithm
The Aspen FACE Experiment, Rhinelander, WI • Established in 1997 • 10 years of treatment • Four treatments, 3 reps • 2x CO2 – ambient & 550 • 2x O3 – 2x ambient trace • 2x CO2 + O3 • Control • Mix of ozone sensitive and ozone tolerant clones • Numerous response variables, including photosynthesis work
Revisions to photosynthesis model • Sensitivity to available soil moisture (Fw) • Wang & Leuning 1988 • Fw = min(1, 4*(s - min)/(max - min)) • s – soil moisture content (from National Climatic Data Center) • min – wilting point (from STATSGO soils database) • max – field capacity (from STATSGO soils database) • Fw scales between 0 and 1 .0 • Applied as correction factor to Vcmax & Jmax
Revisions to photosynthesis model • Previous parameters based on chamber studies (O. Kull, M. Coleman); open air response likely differs • Parameterized model with FACE site data • Asko Noormets & Anu Sober • 1998 2-3 yr old trees, LPIs 9-23 (recently mature leaves)
Revisions to photosynthesis model:Temperature response for Rd • Anu Sober – A/Ci curves • directly measured Dark Respiration (Rd) • Rd values corrected for gasket error • Fit Arrhenius function to corrected Rd data
Revisions to photosynthesis model:Vcmax Parameterization • Revised approach to estimating Vcmax • Given corrected Rd, Bernacchi G*, Km and A/Ci points • Rearrange standard Farquhar model to calculate Vcmax directly • This resolves problems related to estimating Vcmax using data at the low part of the A/Ci curve • Data is highly scattered at Ci < 100 • Respiration and leakage around the gasket become important sources of error at low Ci
Revisions to photosynthesis model: Vcmax Temperature Response • Change from linear to peaked temperature model • Peak came from fitting process, but is in line with literature values (Optimum temperature at ~38 C)
Photosynthesis Model Evaluation: FACE data • Measured vs Simulated A using temperature, CO2 and RH data
Photosynthesis Model Evaluation: independent data BOREAS studies • Boreas TE-12 data • Slope = 1.0 • R2 = 0.89
Patch scale modeling • “Core” trees • n x n matrix of independently simulated trees • “Buffer” trees • Translated copies of core trees • Shade rings • Rings of buffer trees 3 x 3 patch of core trees 2 shade rings
Patch modeling attributes • Patch grows at an hourly time step • Tasks distributed among processors • Allows independent growth of core trees • Mix of clones • Assess: • Clonal interactions • Tree spacing effects • Patch scale metrics • Mean & sd 2 x 2 patch of core trees 2 shade rings
Parallel modeling platform • UMD Beowulf Cluster (RIP) & U of MN Supercomputer • IBM BladeCenter Linux Cluster • Communication via Message Passing Interface (MPI) • Processing capabilities • 309 nodes • Each node has 2 dual core 2.6 GHz AMD Processors sharing 8Gb memory • 1236 processors
Patch model sensitivity analysis • Which variables most strongly influence growth of forest patches? [Rich Mather, UMD Mathematics Thesis] • Explored fractional factorial designs for testing multiple factors • Tree spacing (1 m, 2 m) • Core size (3x3, 6x6) • Number of shade rings (3, 6) • Weather (1999- cool, lower light; 2005 (warm, sunny) • Leaf drop parameters
Sensitivity analysis results • Which variables most strongly influence growth of forest patches? • Weather (1999- cool, 2005 -warm) – strong positive effect • Tree spacing (1 m, 2 m) – slight positive effect @ 2m • Leaf drop parameters – slight negative effect @ greater leaf drop • Core size (3x3, 6x6) – no effect • Number of shade rings (3, 6) – no effect
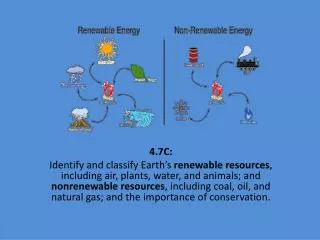
Landscape modeling of ozone • Ozone • Photochemically produced trace gas • Increasing ~3%/yr • Impairs human health • Damage to plant tissues • USFS Forest Health Bioindicators program • Plant clones of known ozone sensitivities as environmental sentinels • Use patch model as sampling tool to assess regional scale ozone response
Regional ozone modeling • Region - north central US • Atmospheric modeling to simulated regional ozone concentrations in response to increased anthropogenic emissions • Emissions projected to 2020 & 2040 • Actual O3 data from sensors interpolated over 24 x 24 km grid • End product - 90 day trace of hourly ozone values Regional ozone modeling by Jerome Fast, Pacific NW Research Lab Warren Heilman, USFS, East Lansing, MI
Landscape modeling: simulation design • 3 year run • 2 weather years • Patch specs • 2 clones (216,259) • 2 x 2 core • 2 shade rings • 1 m spacing • 1500 points/run
2040 decrement in D2H Median decrement= 6% Range 0 – 10%
Summary • Modeling • Photosynthesis modeling improved • Patch modeling allows for aboveground interactions among trees of different genotype • Intensive canopy models are computationally tractable • Applications • Projected increases in ozone result up to 10% reductions in productivity across the landscape • Changes in productivity have high spatial variability
Thank you! Thanks to Anu Sober & Asko Noormets The Aspen FACE Experiment Funding through the USDA Forest Service Northern Global Change Program Competitive Grants Program CPU cycles from University of Minnesota Supercomputer Institute
Aspen FACE Experimental Design • Measure the response of trees, soil system, insects and disease