Download
1 / 23
230 likes | 370 Vues
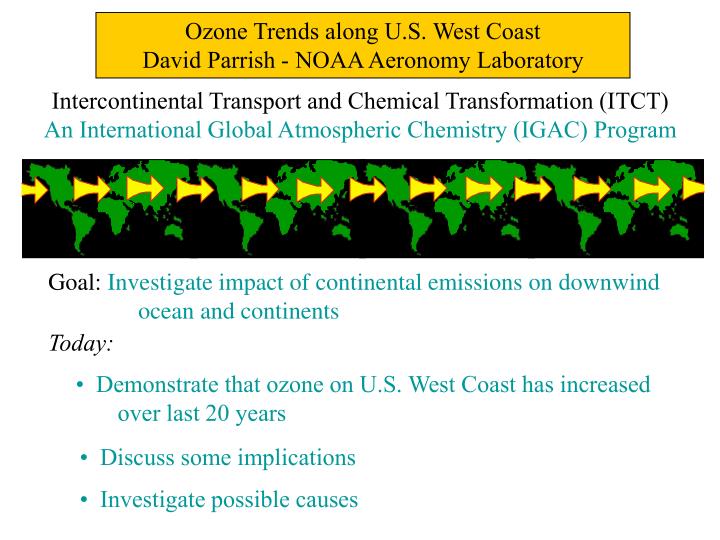
Ozone Trends along U.S. West Coast David Parrish - NOAA Aeronomy Laboratory. Intercontinental Transport and Chemical Transformation (ITCT) An International Global Atmospheric Chemistry (IGAC) Program. Goal: Investigate impact of continental emissions on downwind

E N D
Ozone Trends along U.S. West Coast David Parrish - NOAA Aeronomy Laboratory Intercontinental Transport and Chemical Transformation (ITCT) An International Global Atmospheric Chemistry (IGAC) Program Goal: Investigate impact of continental emissions on downwind ocean and continents Today: • Demonstrate that ozone on U.S. West Coast has increased over last 20 years • Discuss some implications • Investigate possible causes
Why focus on Asian Emissions, North Pacific and US West Coast? • Several studies in North Pacific region over last 2 decades • Asian emissions increased significantly over period of studies - Look for parallel change in ambient levels • Not a uniquely important region in terms of impact
Caveats: • Very few “background” data • Relatively short records Cheeka Peak 1997-2002 Springtime O3 Trends Focus on Spring Season: • Strongest Asian outflow Redwood National Park Lassen Volcanic National Park • Strongest trans-Pacific transport • Most studies Trinidad Head 2002 6 ground sites 2 aircraft studies: NASA CITE 1C in 1984 NOAA ITCT 2K2 in 2002 Pt. Arena 1985 Pt. Reyes NationalSeashore
(Data selected to avoid North American influence) Springtime mean O3 levels have increased Increasing background ozone during spring on the west coast of North America, Jaffe et al., Geophys. Res. Letters, 30, 2003 Conclusion: Along the U.S. west coast, springtime O3 has increased by ≈ 0.5 ppbv/yr, i.e. ≈10 ppbv in 20 years or ≈1-1.5 %/yr
Altitude dependence of springtime O3 increase • Two springtime aircraft studies • Same dates, same region (Select marine air only)
Altitude dependence of springtime O3 increase • Two springtime aircraft studies • Same dates, same region Conclusion: Increase in O3 is seen at all altitudes. One indication that it is not strictly local effect. (Select marine air only)
Seasonal dependence of O3 increase Ozone observations 1988-2001 from N.P.S. site at Lassen N.P. Conclusion: O3 increase may be present in all seasons. (Analysis by Dan Jaffe, University of Washington, Bothell)
Do changes in background O3 matter? Change in background O3 Small changes in background O3 make it harder for us to meet our air quality standard ! (Analysis by Dan Jaffe, University of Washington, Bothell)
Summer 2003: Record year for Siberian forest fires Aircraft profile on June 2, 2003 found layers of enhanced smoke, carbon monoxide and ozone in these air masses. Is there a connection with climate change? (Analysis by Dan Jaffe, University of Washington, Bothell)
June 2003 Siberian forest fire impacted Seattle air quality June 6 at Enumclaw, Washington Local pollution combined with LRT pushed this site over the air quality standard! (Analysis by Dan Jaffe, University of Washington, Bothell)
Emission Oxidation of reduced C species CH4 VOC’s CO h O3 O(1D) + O2 O(1D) + H2O 2OH Production of hydroxyl radical CO2 + H2O OH NO2 O3 O 2O2 C H3C h O O NO2 HO2 NO O2 O3 Production of PAN Radical chain chemistry performs oxidation VOC’s + OH …. …. +NO2 PAN Absence of NOx destroys O3 Presence of NOx catalyzes O3 production Transports NOx Atmospheric Photochemistry Primer
Mean Springtime PAN levels have increased Conclusion: Along the U.S. west coast, springtime PAN has increased by ≈ 3-4 %/yr. Consistent with increasing Asian emissions. Caveat: PAN levels are highly variable and available data are extremely limited (ITCT 2K2 Aircraft data limited to marine boundary layer)
Conclusions from Pt. Arena Study: (Parrish et al., JGR, 97, 15,883, 1992) Trinidad Head • High northwest winds select for • marine boundary layer air. Similar HC variations, but O3 not nearly as affected. • Hydrocarbons and O3 vary together. • Photochemical aging of Asian • emissions largely responsible • for variations. Pt. Arena
O3 increase greater at the lower levels O3 levels below 20 to 30 ppbv are much less likely now than in the mid- 1980’s
Emission Oxidation of reduced C species CH4 VOC’s CO h O3 O(1D) + O2 O(1D) + H2O 2OH Production of hydroxyl radical CO2 + H2O Photochemical Clock ethane + OH …. t ≈40 days propane + OH …. t ≈10 days As fresh emissions age, propane/ethane ratio decreases Ratio insensitive to dilution Atmospheric Photochemistry Primer
Conclusion: As Asian NOx emissions have increased, Pacific photochemistry has become less efficient at destroying O3 O3 dependence on VOC aging 60 50 • In 1985 O3 was destroyed • efficiently as VOC’s • aged 40 30 • In 2002 O3 was destroyed • only slowly as VOC’s • aged O3 (ppbv) 20 (Select marine air only)
Impact of Asian Emissions on the Photochemistry of the North Pacific Troposphere Summary: In springtime • Asian emissions have increased by ≈ 5% / year over last 20 years • O3 levels in Eastern Pacific have increased by ≈ 1-1.5 % / year • PAN levels in Eastern Pacific have increased by ≈ 3-4 % / year • Pacific photochemistry has become less efficient sink for O3 Caveat: Based on very few “background” data of short time span. 1985 Pt. Arena data are only early PAN and VOC measurements collected over 10 day period
Implication Air Quality Control is beginning to have an international dimension Acknowledgements Ozone Measurements: National Park Service Air Resources Division NASA GTE Data Archive PHOBEA - Jaffe et al. PAN Measurements: Hydrocarbon Measurements: NCAR - Ridley et al.; Flocke et al. NCAR - Atlas et al. SRI - Singh et al. SRI - Singh et al. PHOBEA - Kotchenruther et al. NOAA - Roberts et al.
Propane concentration can substitute. In the past 18 years, O3 decreases much less strongly with HC aging in spring in the Pacific MBL. Hydrocarbon ratios provide a photo- chemical clock.
ITCT 2002 Aircraft data: Similar to Trinidad Head data ITCT HC MBL samples (< 1 km) Select marine air only Can we find any other data similar to Pt. Arena?
Further south but also less O3 dependence TRACE-P data: 2000 TRACE-P HC DC-8 and P-3 MBL > 25 N aged
Similar to Pt. Arena, but largely tropical PEM West B data: 1994 PEM West B HC DC-8 MBL < 25 N aged