Download
1 / 1
10 likes | 130 Vues
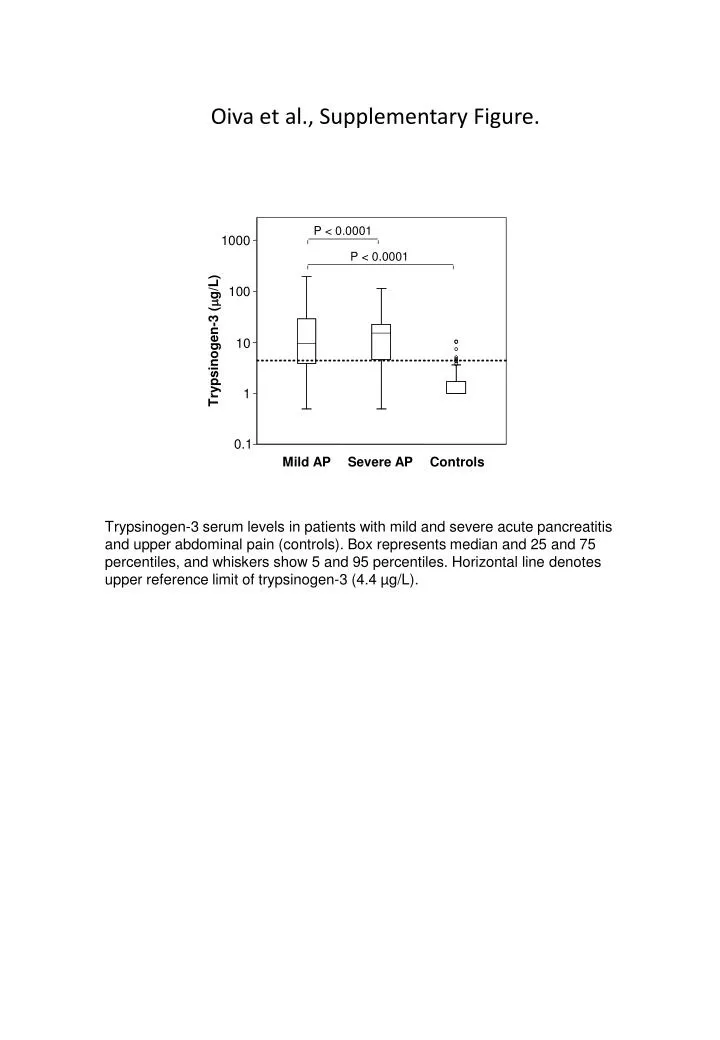
Oiva et al., Supplementary Figure. P < 0.0001. 1000. P < 0.0001. 100. Trypsinogen-3 ( g/L). 10. 1. 0.1. Mild AP. Severe AP. Controls.

E N D
Oiva et al., Supplementary Figure. P < 0.0001 1000 P < 0.0001 100 Trypsinogen-3 (g/L) 10 1 0.1 Mild AP Severe AP Controls Trypsinogen-3 serum levels in patients with mild and severe acute pancreatitis and upper abdominal pain (controls). Box represents median and 25 and 75 percentiles, and whiskers show 5 and 95 percentiles. Horizontal line denotes upper reference limit of trypsinogen-3 (4.4 µg/L).