Download
1 / 41
410 likes | 530 Vues
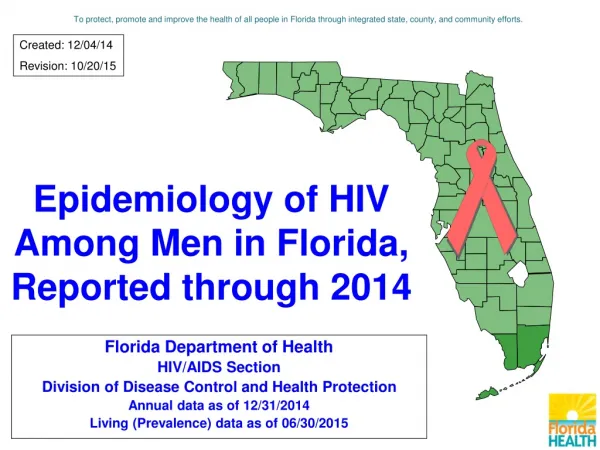
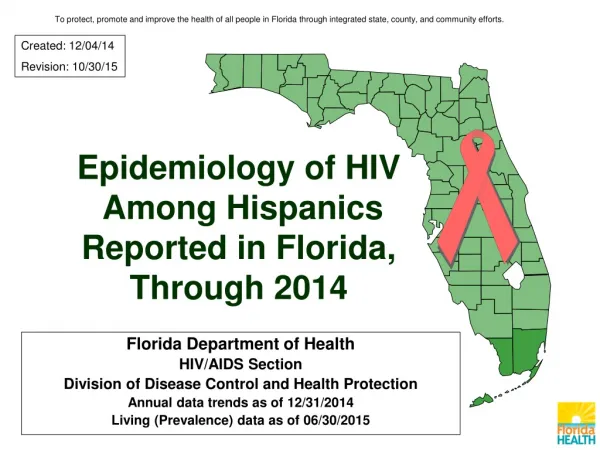
Created: 07/31/12 Revision: 11/06/12. Epidemiology of HIV among Hispanics Reported in Florida, Through 2011. Florida Department of Health HIV/AIDS & Hepatitis Program Annual data trends as of 12/31/2011 Living (Prevalence) data as of 05/16/2012. HIV and AIDS Case Data.

E N D
Created: 07/31/12 Revision: 11/06/12 Epidemiology of HIV among Hispanics Reported in Florida,Through 2011 Florida Department of Health HIV/AIDS & Hepatitis Program Annual data trends as of 12/31/2011 Living (Prevalence) data as of 05/16/2012
HIV and AIDS Case Data • Adult cases represent ages 13 and older, pediatric cases are those under the age of 13. For data by year, the age is by age of diagnosis. For living data, the age is by current age at the end of the most recent calendar year, regardless of age at diagnosis. • Unless otherwise noted, whites are non-Hispanic and blacks are non-Hispanic. • Total statewide data will include Department of Correction Cases (DOC) unless otherwise noted. County data will exclude DOC cases. • HIV prevalence data are generated later in the year, usually in May, when most of the “expected” death data are complete. Selected slides from the Florida HIV Trends Slide Set, see site below for entire set.http://www.doh.state.fl.us/disease_ctrl/aids/trends/slides/slides.html
<20% >20% Adult AIDS and HIV Cases, by County of Residence Reported among Hispanics in 2011, Florida HIV AIDS
Adult AIDS Case Rates* among Hispanics, by County of Residence,**Reported in 2011, Florida Statewide Data among Hispanics: N=646 State Rate among Hispanics= 19.0 Rate per 100,000 Population 0.0 0.1 to 25.0 25.1 to 50.0 50.1 to 75.0 Over 75.0 Note: high rates in small counties may be unreliable due to small county population. *Population data are from FloridaCHARTS **County totals exclude Department of Corrections cases (N=4).
Statewide Data: N=1,356 State Rate = 38.7 Rate per 100,000 Population 0.0 0.1 to 20.0 20.1 to 30.0 30.1 to 40.0 Over 40.0 Adult HIV Case Rates* among Hispanics, by County of Residence,**Reported in 2011, Florida Note: high rates in small counties may be unreliable due to small county population. *Population data are from FloridaCHARTS **County totals exclude Department of Corrections cases (N=5).
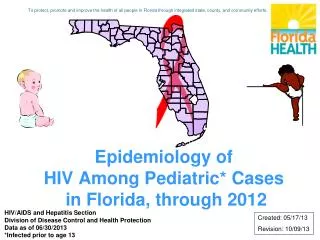
Pediatric* HIV/AIDS Cases and State Population** in Children <13 years of age, by Race/Ethnicity, Reported* through 2011, Florida Pediatric HIV/AIDS Cases N=2,520 Population Estimates N= 2,841,831 Note: Non-Hispanic blacks are disproportionately affected by HIV/AIDS compared with those of other race/ethnicities. This same trend is seen in adult HIV/AIDS cases but is more pronounced in those diagnosed with HIV Disease under 13 years of age. *The first pediatric AIDS case was reported in 1983. **Source: Population estimates are provided by Florida CHARTS
Black White Hispanic Adult HIV Infection Cases by Race/Ethnicity and Year of HIV Diagnosis Florida, 2002 – 2011 Percentage change from 2002 – 2011: Whites: -20% Blacks: -42% Hispanics: -21% Data as of 06/30/2012
Black White Hispanic Adult MALE HIV Infection Cases by Race/Ethnicity and Year of HIV Diagnosis Florida, 2002 – 2011 Percentage change from 2002 – 2011: White males: -18% Black males: -34% Hispanic males: -15% Data as of 06/30/2012
Black White Hispanic Adult FEMALE HIV Infection Cases by Race/Ethnicity and Year of HIV Diagnosis Florida, 2002 – 2011 Percentage change from 2002 – 2011: Whites: -32% Blacks: -53% Hispanics: -45% Data as of 06/30/2012
White Black Hispanic Other** Adult AIDS and HIV Infection Cases Reported in 2011 and Population, by Race/Ethnicity, Florida 2011 Florida* Population Estimates N=16,092,456 AIDSN=3,441 HIVN=6,027 Note: Blacks comprise only 15% of the adult population in Florida, but represent 55% of adult AIDS cases and 48% of adult HIV infection cases reported in 2011 . *Source: Population estimates are provided by FloridaCHARTS **Other includes Asian/Pacific Islanders, Native Alaskans/American Indians and mixed races.
Adult HIV Infection Cases, by Sex and Race/Ethnicity, Reported in 2011, Florida Males N=4,608 Females N=1,419 Note: In this snapshot of 2011, HIV cases by race/ethnicity among males is more evenly split compared to HIV cases among females where blacks are over-represented, accounting for 65% of adult cases among women. *Other includes Asian/Pacific Islanders, Native Alaskans/American Indians and mixed races
Adult HIV Infection Case Rates* by Sex and Race/Ethnicity, Reported in 2011, Florida Rate Ratios: MALES Blacks:Whites, 4.8:1 Hispanics:Whites, 2.0:1 FEMALES Black:Whites, 14.0:1 Hispanics:Whites, 2.2:1 Note: Similar to AIDS, black men and, to an even greater extent, black women are over-represented in the HIV epidemic. The HIV case rate for 2011 is nearly 5 times higher among black men than among white men. Among black women, the HIV case rate is 14 times higher than among white women. Hispanic male case rates are 2 times and Hispanic female rates are 2 times higher than the rates among their white counterparts. *Source: Population estimates are provided by FloridaCHARTS
Definitions of Mode of Exposure Categories • MSM = Men who have sex with men • IDU = Injection Drug Use • MSM/IDU = Men who have sex with men & Injection Drug Use • Heterosexual = Heterosexual contact with person with HIV/AIDS or known HIV risk • OTHER = includes hemophilia, transfusion, perinatal and other pediatric risks and other confirmed risks. • NIR = Cases reported with No Identified Risk • Redistribution of NIRs = This illustrates the effect of statistically assigning (redistributing) the NIRs to recognized exposure (risk) categories by applying the proportions of historically reclassified NIRs to the unresolved NIRs.
HIV Infection Cases among Adult Hispanic Males, by Mode of Exposure and Year of Report, 2002–2011, Florida Note: NIRs redistributed. Men who have sex with men (MSM) remains as the primary mode of exposure among Hispanic male HIV cases in Florida, followed by heterosexual contact.
HIV Infection Cases among Adult Hispanic Females, by Mode of Exposure and Year of Report, 2002–2011, Florida Note: NIRs redistributed. The heterosexual risk continues to be the dominant mode of exposure among Hispanic females.
Cases Living with HIV Disease • Data in these slides represent cases living with HIV Disease, also referred to Persons Living with HIV/AIDS (PLWHAs), who were reported through the most recent calendar year. Living data are also referred as prevalence cases. • HIV prevalence data are generated later in the year, usually in May, when most of the “expected” death data are complete. • Adult cases represent ages 13 and older, pediatric cases are those under the age of 13. For data by year, the age is by age of diagnosis. For living data, the age is by current age at the end of the most recent calendar year, regardless of age at diagnosis. • Unless otherwise noted, whites are non-Hispanic and blacks are non-Hispanic. • Total statewide data will include Department of Correction Cases (DOC) unless otherwise noted. County data will exclude DOC cases. Selected slides from the Florida HIV Prevalence Slide Set, see site below for entire set.http://www.doh.state.fl.us/disease_ctrl/aids/trends/slides/slides.html
Hispanics Living with HIV/AIDS In the US* and in Florida *Source: Source of US data: CDC HIV Surveillance Report 2010, Vol. #22, (2011 data not yet available, HIV data is only for 46 states). The US data represents 40 states with confidential name-based HIV infection reporting **Source: The Florida data represents living HIV/AIDS cases through 2010 as of 05/26/2011.
Adults Living with HIV Disease,by Sex and Race/Ethnicity Reported through 2011, Florida Males N=68,211 Females N=29,225 Note: Among living HIV/AIDS cases, blacks represent the highest race among both males (40%) and females (69%). *Other includes Asian/Pacific Islanders and Native Alaskans/American Indians.
Case Rates* of Adults Living with HIV Disease, by Sex and Race/Ethnicity, Reported through 2011, Florida RATE RATIOS: MALES Blacks:Whites, 5:1 Hispanics:Whites, 2:1 Others:Whites, 1:1 FEMALES Black:Whites, 18:1 Hispanics:Whites, 2:1 Others:Whites, 2:1 Note: Among black males, the HIV/AIDS case rate for cases Reported through 2011 is 5 times higher than among white males. Among black females, the AIDS case rate is 18 times higher than among white females. Hispanic male and female rates are 2 times higher than the rates among their white counterparts. *Source: Population estimates are provided by FloridaCHARTS **Other includes Asian/Pacific Islanders and Native Alaskans/American Indians.
One-In-Statement for Adults There were 97,174 reported adult (age 13+) Persons Living with HIV Disease (PLWHAs) in Florida through 2011. 1 in 166 adult Floridians are known to be currently living with HIV infection. By Race/Ethnicity (adults age 13+): • 1 in 336 whites are currently living with HIV infection • 1 in 49 blacks are currently living with HIV infection • 1 in 181 Hispanics are currently living with HIV infection Data as of 05/16/2012
Hispanic Adults Living with HIV Disease, by Sex and Current Age Group, Reported through 2011, Florida Males N=15,483 Females N=3,860 Note: Hispanic males living with HIV disease have a slightly higher proportion of cases who are currently 40 years of age or older (72%), compared with Hispanic females living with HIV Disease (69%).
The Proportion of HIV Infection Among Hispanics Living with HIV by Transmission CategoryIn the U.S.* Compared to Florida Among Hispanic males living with HIV, Florida has a significantly higher proportion of MSM cases and a much lower proportion of IDU cases compared to the U.S. Among Hispanic females living with HIV, Florida had a much higher proportion of heterosexual cases and a much lower proportion of IDU cases than that for the U.S. *U.S. data: HIV Surveillance Report, 2010 (most recent available) Vol. 22
Adult Males Living with HIV Diseaseby Race/Ethnicity and Mode of Exposure Reported through 2011, Florida Hispanic N=15,483 White N=24,101 Black N=27,335 Note: NIRs redistributed. Among males living with HIV disease, the distribution of risk among blacks differs from that among whites and Hispanics. MSM represents the highest risk for all races. White males have the smallest proportion of heterosexual contact cases.
Adult Females Living with HIV Diseaseby Race/Ethnicity and Mode of Exposure Reported through 2011, Florida Hispanic N=3,860 White N=4,544 Black N=20,166 Note: NIRs redistributed. Among females living with HIV disease, the distribution of risk among whites differs from that among blacks and Hispanics. Heterosexual contact is the majority risk for all races, However, whites have the highest proportion of IDU cases.
HIV Mortality in Florida Resident HIV deaths due to HIV disease represent persons who resided in Florida and whose underlying cause of death was HIV disease, regardless if they were reported with HIV disease in Florida or not. The data source is death certificate data from the Florida Department of Health, Office of Vital Statistics. HIV case deaths are known cases of HIV disease (regardless of AIDS status) reported in Florida and are known to be dead, regardless of the cause of death. It is important to understand if any known HIV/AIDS cases died in any given year for estimates of the current burden of HIV/AIDS care and treatment needs within the state. The data source is the Florida HIV/AIDS Reporting System (eHARS) from the Florida Department of Health, Bureau of HIV/AIDS. Selected slides from the Florida Deaths Slide Set, see site below for entire set.http://www.doh.state.fl.us/disease_ctrl/aids/trends/slides/slides.html
Rate* of Resident Deaths** due to HIV Disease,by Sex and Race/Ethnicity, 2011, Florida MALES Rate ratios Blacks:Whites, 7:1 Hispanics:Whites, 1:1 FEMALES Rate ratios Black:Whites, 17:1 Hispanics:Whites, 1:1 Note: In 2011, black males were 7 times as likely as white males to die of HIV/AIDS. The HIV/AIDS death rate among black females was 17 times higher than among white females. *Source: Population data are provided by FloridaCHARTS. **Source: Florida Department of Health, Office of Vital Statistics, Death Certificates (as of 07/12/2012).
Black White Hispanic Resident Deaths* due to HIV Disease, by Race/Ethnicity and Year of Death, 2002-2011, Florida Note: In 2011, the proportional distribution of resident HIV deaths due to HIV by race/ethnicity was: whites 26%, blacks 61%, Hispanics 12% and other 1%. This compares to 27%, 59%, 11% and 2% respectively for 2010. *Source: Florida Department of Health, Office of Vital Statistics, Death Certificates (as of 07/12/2012).
Leading Causes of Death among Hispanics 25-44 Years Old by Sex, 2011, Florida Hispanic Men HIV is 6thleading cause Hispanic Women HIV is 8th leading cause
Median Survival Time (in months) from AIDS Diagnosis to Death, by Race/Ethnicity and Time Period of Death, 1980-2011, Florida Note: In the early years, survival times for increased for all race/ethnicity groups with the introduction of AZT in 1994. With the introduction of Highly Active Retroviral Therapy (HAART) in 1996, survival time increased significantly for all age groups, however, overall survival times are not without racial/ethnic disparities. *Source: Florida Department of Health, Bureau of HIV/AIDS, HIV/AIDS Reporting System (as of 07/12/2012)
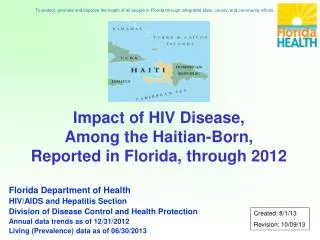
Impact of HIV Diseaseamong Hispanics, by Country of Birth in Florida,Reported Through 2011 Selected slides from the Country of Birth Slide Set, see site below for entire set.http://www.doh.state.fl.us/disease_ctrl/aids/trends/slides/slides.html
Hispanic Foreign-Born HIV/AIDS Cases, by Country of Birth and Year of Report, 2002-2011, Florida Note: Each year, the majority of Hispanic foreign born HIV/AIDS cases with a known country of birth were Cuban born followed by Puerto Rican born.
Hispanic Foreign-Born, Adult HIV/AIDS Cases, Known Dead, Regardless of Cause, by Country of Birth and Year of Death, Florida, 2002-2011 Note: Each year, the majority of Hispanic foreign born HIV/AIDS case deaths with a known country of birth were Cuban born, followed by Puerto Rican born.
Foreign-Born US Born Unknown* Hispanic Adults Living with HIV Disease, by Country of Birth & Sex, Reported through 2011, Florida Males N=15,483 Females N=3,860 The majority (59% for males and 51% for females) of Hispanics living with HIV disease in Florida were foreign born.
Hispanic Adults Living with HIV Disease, by Selected Country of Birth, Reported through 2011, Florida 0 Cases 1-50 Cases 51-100 Cases Over 100 Cases Living HIV/AIDS Cases Cuba N=2,806 Puerto Rico N=1,886
Hispanic Adults Living with HIV Disease, by Country of Birth*, reported through 2011,for Florida and Selected South Florida Counties** *Data sorted by foreign country of birth by number of cases, and excludes cases whose country of birth is unknown. **County data exclude Department of Correction cases.
Hispanic Adult Males Living with HIV Disease,by Selected Country of Birth and Mode of Exposure, Reported through 2011, Florida Cuba N=2,575 U.S. Born N=4,393 Puerto Rico N=1,420 Note: NIRs redistributed. Injection drug use is a much more common risk factor among male cases born in Puerto Rico, while MSM cases were more predominate among Cuban-born and US-born cases.
Hispanic Adult Females Living with HIV Disease,by Selected Country of Birth and Mode of Exposure, Reported through 2011, Florida U.S. Born N=1,451 Cuba N=296 Puerto Rico N=532 Note: NIRs redistributed. Female Cuban-born cases were less likely to be injection drug users than their U.S.-born or Puerto Rico-born counterparts.
Underlying Factors Affecting HIV/AIDS Disparities - Amount of HIV already in the community • Late diagnosis of HIV or AIDS* • Access to/acceptance of care* • Stigma, denial*, • Discrimination, homophobia* • HIV/AIDS complacency* • Poverty and unemployment *Factors that HIV/AIDS initiatives can impact.
Minorities are at high risk for HIV infection… • NOT because of their race • NOT because of their ethnicity… • But BECAUSE of risk behaviors they may engage in. IT’S NOT WHO YOU ARE, BUT WHAT YOU DO.
For Florida HIV/AIDS Surveillance Data • Contact: (850) 245-4444 • Lorene Maddox, MPH Ext. 2613 • Tracina Bush, BSW Ext. 2612 • Julia Fitz, MPH Ext. 2373 • Visit Florida’s internet site for: • Monthly Surveillance Reports • Slide Sets and Fact Sheets • Annual Reports and Epi Profiles • http://www.doh.state.fl.us/disease_ctrl/aids/trends/trends.html • Visit CDC’s HIV/AIDS Internet site for: • Surveillance Reports, fact sheets and slide sets • http://www.cdc.gov/hiv/topics/surveillance/resources/reports/index.htm