Download
1 / 20
200 likes | 348 Vues
Data modeling using ER. Entity relationship diagrams. Why analyze data?. Insight in data - and structures of data. Create a structure in “unstructured” data Prior to designing a database A part of the systems development process. ER modeling.

E N D
Data modeling using ER Entity relationship diagrams Data modeling using ER
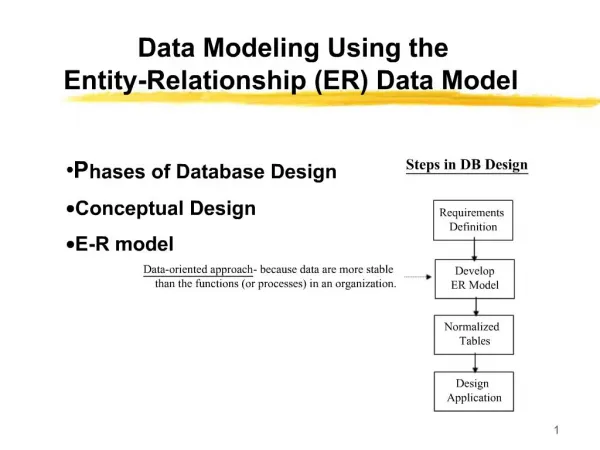
Why analyze data? • Insight in data - and structures of data. • Create a structure in “unstructured” data • Prior to designing a database • A part of the systems development process. Data modeling using ER
ER modeling • ER modeling is a widely used technique for data analysis. • Many notations (syntax) for ER diagrams • Different book different notations • Diagrams can be drawn using Visio or a similar tool. Data modeling using ER
Entities with attributes • Characteristics of an entity • An important ”thing” in the world we model. • Entities have attributes (data) • Similar to a class in OOA, but has no methods / functions. • Notation (this book) • Entity: Rectangle • Attribute: Oval Data modeling using ER
Types of attributes • Simple or composite attributes • simple (atomic) e.g. age • Notation: Oval • composite • address = street + number + ZIP code + town • Notation: Oval connected to several ”sub” ovals. Data modeling using ER
Types of attributes II • Single valued or multi-valued • Single valued e.g. CPR • Multi-valued e.g. phone number • One person may have several phones • Notation: Double oval • An attribute may be composite and multi-valued! Data modeling using ER
Types of attributes III • Derived: Calculated from other attributes e.g. sum or average • Notation: Oval with a dashed border • An attribute with no value has value NULL • Values does not exist. • Value unknown. Data modeling using ER
Entities • An entity type is like a class • Naming convention: Substantive, singular • Every “instance” of the entity must be unique • Identified by a key, one or more attributes • Notation for keys: Underline the name of the attribute(s) Data modeling using ER
Relationships • Relationships between entities. • Notation: Rhomb • Similar to association in OOA. • Relationships may have attributes • Notation: Oval Data modeling using ER
Relationships II • Binary relationship • Relationship between 2 entities (normal) • Relationships, higher degree • Relationship between more entities (rare) • Recursive relationships • Relationship of 2 entities belonging to the same entity type e.g. an employee with a relation to another to a boss (another employee) Data modeling using ER
Cardinality • 1-1 very rare • 1 entity of type A has a relation to at most 1 entity of type B and vice versa • 1 husband ~ 1 wife • 1-many, 1-N very common • 1 entity of type A may have relation to many entities of type B, not vice versa. • 1 department ~ many employees Data modeling using ER
Cardinality II • Many - many, N-M common • 1 relation of type A may have relations to many entities of type B and vice versa. • 1 employee ~ many projects • 1 project ~ many employees Data modeling using ER
Cardinality notation • Step into the entity type and look at the other entity through the relation. • How many entities of the other type do you see? • Write the number on far end of the relation. Data modeling using ER
(min, max) cardinality • Often you’re only concerned with max. cardinalities. • Sometimes you want both (min, max) cardinality. • Note: Cardinalities placed in the other end of the relation!!! Data modeling using ER
History • History: More generations of relations • Cardinality goes up • 1 man ~ many wives [not simultaneously] • Put a timestamp / period on the relation (attribute on the relation) • Relation marriage: start_date, end_date • end_date may be NULL :-) Data modeling using ER
Total participation • Ordinary relation • An entity may be related to another entity. • Total participation • En entity must be related to another entity. • Min. cardinality 1 (not 0) • Notation: Double line on the relation Data modeling using ER
Weak entities • An entity that is dependent on some other entity. • If the ”strong” entity is deleted so is the weak entity. • Notation: • Weak entity: Rectangle with double borders • Identifying relationship: Rhomb with double borders (shows the strong entity) Data modeling using ER
Weak entities II • A weak entity has a partial key • Not unique • Unique in combination with the key from the ”strong” entity. • Notation: Dashed line under the partial key. Data modeling using ER
Diagramming tools • Drawing • Microsoft Visio [now a part of MS Office] • Diagramming to generate tables • You draw ER, the tool generates tables • Reverse engineering • You have the tables, the tools generates ER. • Don’t use tools early in the process - use pen and paper!!! Data modeling using ER
Best practice • Procedure (best practice) • find entities and [easy] attributes • relationships • cardinalities • keys • weak entities • total participation Data modeling using ER