Download
1 / 48
480 likes | 663 Vues
Analyzing ChIP-chip data using Bioconductor a tutorial. Joern Toedling Huber group November 2008. a few words about me. Education Medical studies at Freie Universität (FU) Berlin – until Feb 2000

E N D
Analyzing ChIP-chip datausing Bioconductora tutorial Joern Toedling Huber group November 2008
a few words about me Education Medical studies at Freie Universität (FU) Berlin – until Feb 2000 B.Sc. (Oct 2003) and M.Sc. (Feb 2005) in Bioinformatics, FU Berlin,Thesis advisors: Rainer Spang and Martin Vingron Ph.D. - Bioinformatics (submitted Aug 08); Jesus College, University of Cambridge & EMBL European Bioinformatics Institute, Dissertation title:”Comprehensive analysis of high-throughput experiments for investigating transcription and transcriptional regulation”; Dissertation advisor: Wolfgang Huber Research Interests Integrative analysis of high-throughput genomics experiments Transcription and transcriptional regulation Development of cancer
research experience EMBL European Bioinformatics Institute Cambridge, UK March 2005 - present Doctoral Candidate, Huber group • Tiling microrray transcriptome studies in S. cerevisiae • ChIP-chip studies on transcriptional regulation in M. musculus • Software development for reproducible, integrative analysis of high-throughput genomics experiments (Bioconductor) Max Planck Institute for Molecular Genetics Berlin, Germany September 2002 - February 2005 Affiliate Research Associate in the Dept. of Computational Biology • Semi-automated analysis of flow-cytometry experiments for leukemia diagnois • Applications of gene expression microarrays in the stratification of acute lymphocytic leukemias • Cross-platform comparison of microarray experiments • Software development for Bioconductor
Outline Background: histone modifications ChIP-chip the example data quality assessment finding ChIP-enriched regions some suggestions for making sense of ChIP-enriched regions Bioconductor
Histone modifications H3K4me3 From: A. P. WOLFFE & J. J. HAYES - Nucleic Acid Research, 27, 711-720 (1999)
Microarrays for investigating histone modifications Two types of oligonucleotide arrays: Chromatin immunoprecipitation (ChIP) two-color arrays from NimbleGen discover modified histones Gene expression arrays from Affymetrix observe expression levels of transcripts with and without associated histone modifications TSS DNA ChIP reporters Expression reporters Image courtesy of NimbleGen systems
ChIP-chip experiments ChIP sample input sample Adapted from: Bertone et al., Chromosome Research, vol. 13, pp. 259-274 (2005)
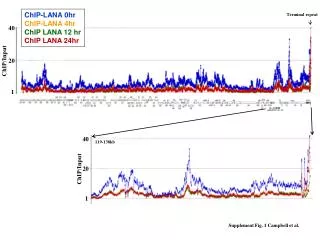
ChIP-chip data Mus musculus brain and heart, for each hybridized on two-color microarrays: 1 ChIP sample with antibody against H3K4me3 (Cy5) hybridized against an untreated genomic input sample (Cy3) 1.5 million 50mer reporters distributed over 4 microarrays designed to represent 32,482 putative Polymerase II binding regions in a very dense tiling (100 bp) designed on mouse genome assembly mm5; re-mapped reporters to current assembly (mm9) using Exonerate
Quality Assessment (QA) to detect artifacts introduced during sample preparation, microarrary hybridization and scanning to check data for certain characteristics that can be expected from the experimental design
QA1: Array surfaces check spatial distribution of raw intensities on array surface can show fingerprints, scratches, or scanning artifacts raw intensities visualised according to position of reporters on microarray surface; color of each dot represents raw probe intensity: brighter color = higher intensity good array → homogeneous distribution of low and high intensities across whole microarray good quality array
QA1: Array surface artifacts for comparison: arrays with artifacts from another study left and middle arrays were discarded; right one was used
QA2: Correlation input vs. ChIP samples Cy3: input samples unspecifically enriched genomic DNA from heart vs. unspecifically enriched genomic DNA from brain Cy5: ChIP samples DNA enriched for H3K4me3 from heart vs. DNA enriched for H3K4me3 from brain
Data preprocessing ChIP-chip data: for each reporter, compute fold-change xi = log (ChIP sample / input sample) and scale log-ratios xi by subtracting xm that is Tukey's biweight mean over all xi Expression data: MAS5 normalization and summarization of reporter levels into “probe set” (-> gene) levels
Why smoothing over individualreporter levels? • Different reporters show different levels even for exactly the same amount of RNA, due to: • reporter specificity • variable synthesis quality • reporter-sequence characteristics, e.g. secondary-structure formation and GC content • reporter-specific dye bias
Sliding-window smoothing can result in biased estimates of segment boundaries
Threshold for calling smoothed reporter levels enriched • Assumption: smoothed reporter levels follow mixture distribution • F(x) = (1-α) F0(x) + α Falt(x) • null distribution F0 for non-affected reporters' levels; symmetric around left mode • alternative distribution Falt of smoothed reporter levels in ChIP-enriched regions; consists of higher values than null distribution
Finding the threshold... • only estimate CDF of null distribution F0 • start by estimating x0, the mode of F0, by the midpoint of the shorth of F(x) for -1 ≤ x ≤ 1 (on a log2 scale)
Finding the threshold... • estimate F0 • values x < x0→ left half of F0 ^
Finding the threshold... • estimate F0 • values x < x0 are reflected onto x > x0 to obtain estimate for symmetric distribution F0 ^
Finding the threshold... • threshold set equal to high quantile, e.g. 99%, of F0(x) ^
Finding ChIP-enriched regions in X is an ExpressionSet containing the preprocessed data object probeAnno holds the mapping between reporters on the microarray and complimentary genome positions. 1. sliding-window smoothing > smoothX <- computeRunningMedians(X, probeAnno=probeAnno, modColumn="Tissue", allChr=c(1:19,”X”,”Y”), winHalfSize=450) 2. finding the threshold on the smoothed levels > y0 <- apply(exprs(smoothX), 2, upperBoundNull, prob=0.99) 3.using this threshold, identify ChIP-enriched regions > chersX <- findChersOnSmoothed(smoothX,probeAnno=probeAnno, thresholds = y0)
ChIP-enriched regions in brain cells: 11852, in heart cells:10391 large ovelap between H3K4me3 regions in brain and heart cells, but also tissue-specific ChIP-enriched regions brain 3641 8211 8125 heart 2266
Relating ChIP-enriched regions to genes we (arbitrarily) say that a ChIP-enriched region is related to a certain gene, if its genomic center position is located between that gene's start and end coordinate less than 5 kb upstream of the gene's start coordinate
Genes related to H3K4me3 regions in mouse tissue samples 814 8,855 2,669 brain heart
GO annotation of genes related to ChIP-enriched regions in one tissue only brain 2,669 genes heart 814 genes
Relating ChIP-enrichment to gene expression ChIP-enriched regions → genes Using biomaRt: Ensembl gene identifiers → probe set identifiers on the Mouse 430v2 Affymetrix expression microarray platform Genes were categorized by whether they were related to any H3K4me3 region in a tissue or not. Compare expression levels between gene categories.
Next steps and conclusions from the ChIP-chip analysis Further annotation of ChIP-enriched regions Integration of results with other experimental data Found regions and biological hypotheses need to be validated in appropriate small-scale experiments. ChIP-chip, as most high-throughput techniques, should primarily be seen as a way to generate hypotheses. Bioconductor: platform for well-stated hypotheses
Software: Ringo & Bioconductor facilitateend-to-end ChIP-chip data analysis
open sourceand open development software project for the analysis of biomedical and genomic data extension packages to the statistical environment R >100 contributing developers, several thousand users in academia and industry 6-monthly release cycle; release 1.0 in March 2003 (15 packages); October 2008: release 2.3 (~ 300 packages)
Provide access to powerful statistical and graphical methods for the analysis of genomic data. Facilitate the integration of biological metadata (GenBank, GO, EntrezGene, PubMed) in the analysis of experimental data. Promote the development of accessible, extensible, transparent and well-documented software. Promote reproducible research. Provide training in computational and statistical methods. Goals
Core packages: common data structures, interfaces and frequently used functionalities for sharing between packages → communication between modules Extension packages: specific functionalities and annotation for specific experiment types (e.g. ChIP-chip) specific research environments (e.g. different organisms) specific platforms (e.g. Affymetrix microarrays) Design principles
Good scientific software is like a good scientific publication Reproducibility Peer-review Easy accessibility by researchers & society Based on the work of others and in turn should provide a new basis
Bioconductor packagesused in this tutorial • Ringo for reading, processing, visualizing ChIP-chip data • biomaRt for retrieving annotated genome elements and for matching gene identifiers to Affymetrix probe set IDs of expression microarrays • topGO for relating lists of genes to Gene Ontology
Summary Bioconductor & Ringo allow complete end-to-end analysis of ChIP-chip data: quality assessment, identification of ChIP-enriched genomic regions, and biological interpretation of found regions. Packages of the Bioconductor project provide a versatile platform for the integrative analysis of high-throughput genomics data.
Further references • L. Barrera et al. (2008) Genome-wide mapping and analysis of active promoters in mouse embryonic stem cells and adult organs. Genome Research 18:46–59. • Several good books to help you get started with R and BioC • Issues with Bioconductor? • Consult the mailing list and its archives bioconductor@stat.math.ethz.ch
Acknowledgements Wolfgang Huber & all members of the Huber group at EBI Leah Barrera & Bing Ren Jenny Fischer & Silke Sperling
Linear model for associating histone modifications to transcript expression y ~ H3ac + H4ac + H3K4me2 + H3K4me3 + GC + cell type + interactions