Download
1 / 4
40 likes | 56 Vues
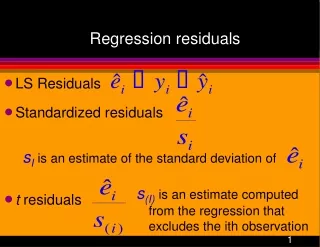
Residuals capture errors in regression models. Plot them on a scatterplot to assess fit and identify patterns for better model selection. Learn interpretations and actions from residual plots.

E N D
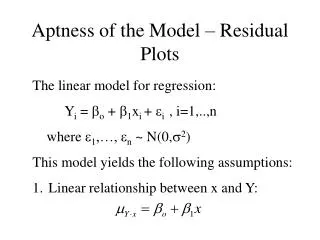
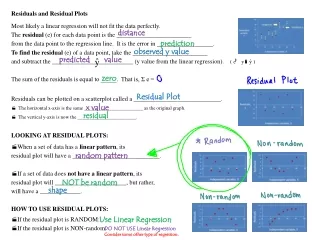
Residuals and Residual Plots Most likely a linear regression will not fit the data perfectly. The residual (e) for each data point is the ________________________ from the data point to the regression line. It is the error in __________________. To find the residual (e) of a data point, take the ________________________ and subtract the __________________________ (y value from the linear regression). The sum of the residuals is equal to _____. That is, Σ e = Residuals can be plotted on a scatterplot called a ____________________________. • The horizontal x-axis is the same ________________________ as the original graph. • The vertical y-axis is now the ________________________. LOOKING AT RESIDUAL PLOTS: • When a set of data has a linear pattern, its residual plot will have a ____________________________. • If a set of data does not have a linear pattern, its residual plot will _______________________, but rather, will have a _____________. HOW TO USE RESIDUAL PLOTS: • If the residual plot is RANDOM: • If the residual plot is NON-random: distance prediction observed y value predicted value zero Residual Plot x value residual random pattern NOT be random shape Use Linear Regression DO NOT USE Linear Regression Consider some other type of regression.
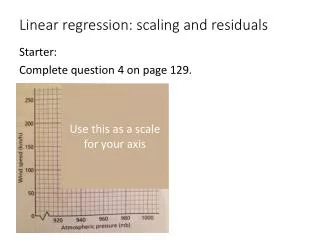
Perfectly Linear Data Draw a scatterplot from the given data. Enter x-values into L1. Enter y-values into L2. Use a calculator to find the linear regression for this data. LinReg y=ax+b a= b= r2= r= Linear regression equation: Draw the linear regression on the same graph as the scatter plot (left). Enter linear regression into Y1. Use the table feature on the calculator to fill in the center column on the residual table (top right). Complete the table. Create a residual plot (right). What do you notice about the residual plot? How does the linear regression fit the data?
Linear Data A scatterplot and linear regression line are already drawn from the given data. Enter x-values into L1. Enter y-values into L2. Use a calculator to find the linear regression for this data. LinReg y=ax+b a= b= r2= r= Linear regression equation: Enter linear regression into Y1. Use the table feature on the calculator to fill in the center column on the residual table (top right). Complete the table. Create a residual plot (right). What do you notice about the residual plot? How does the linear regression fit the data?
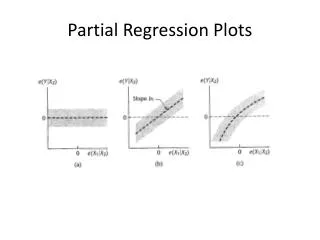
Non-Linear Data A scatterplot and linear regression line are already drawn from the given data. Enter x-values into L1. Enter y-values into L2. Use a calculator to find the linear regression for this data. LinReg y=ax+b a= b= r2= r= Linear regression equation: Enter linear regression into Y1. Use the table feature on the calculator to fill in the center column on the residual table (top right). Complete the table. Create a residual plot (right). What do you notice about the residual plot? How does the linear regression fit the data?