Download
1 / 69
690 likes | 696 Vues
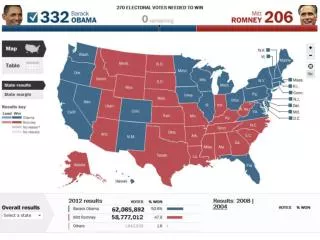
Local Results, by Quartile. Local Results, by Quartile. Cities are divided into quartiles according to the percentage of secondary schools in each city with each school health policy or practice in place

E N D
Local Results, by Quartile • Cities are divided into quartiles according to the percentage of secondary schools in each city with each school health policy or practice in place • Percentages in quartiles change from map to map depending on the range of percentages across all cities • Darker shades indicate a higher percentage of secondary schools with each policy or practice in place • Maps provide relative results (i.e., how cities compare to each other)
Physical Education and Physical Activity
Percentage of secondary schools in which students could not be exempted from taking required physical education for certain reasons* Newark Detroit Philadelphia Chicago San Francisco Baltimore 9% - 30% Washington D.C. Fresno 31% - 53% San Bernardino Memphis 54% - 70% Los Angeles Charlotte- Mecklenburg County Albuquerque 71% - 86% San Diego No Data Houston Orange County Palm Beach County Hillsborough County Broward County Miami *Enrollment in other courses, participation in school sports, participation in other school activities, participation in community sports activities, high physical fitness competency test score, participation in vocational training, and participation in community service activities. School Health Profiles, 2008
Percentage of secondary schools that taught 12 key physical activity topics in a required course Newark Detroit Philadelphia Chicago San Francisco Baltimore 25% - 47% Washington D.C. Fresno 48% - 57% San Bernardino Memphis 58% - 66% Los Angeles Charlotte- Mecklenburg County Albuquerque 67% - 77% San Diego No Data Houston Orange County Palm Beach County Hillsborough County Broward County Miami School Health Profiles, 2008
Percentage of secondary schools that taught about developing an individualized physical activity plan in a required course Newark Detroit Philadelphia Chicago San Francisco Baltimore 41% - 70% Washington D.C. Fresno 71% - 77% San Bernardino Memphis 78% - 83% Los Angeles Charlotte- Mecklenburg County Albuquerque 84% - 100% San Diego No Data Houston Orange County Palm Beach County Hillsborough County Broward County Miami School Health Profiles, 2008
Percentage of secondary schools in which those who teach physical education were provided with key materials for teaching physical education Newark Detroit Philadelphia Chicago San Francisco Baltimore 51% - 78% Washington D.C. Fresno 79% - 85% San Bernardino Memphis 86% - 92% Los Angeles Charlotte- Mecklenburg County Albuquerque 93% - 96% San Diego No Data Houston Orange County Palm Beach County Hillsborough County Broward County Miami School Health Profiles, 2008
Percentage of secondary schools that offered opportunities for all students to participate in intramural activities or physical activity clubs Newark Detroit Philadelphia Chicago San Francisco Baltimore 63% - 80% Washington D.C. Fresno 81% - 83% San Bernardino Memphis 84% - 93% Los Angeles Charlotte- Mecklenburg County Albuquerque 94% - 100% San Diego No Data Houston Orange County Palm Beach County Hillsborough County Broward County Miami School Health Profiles, 2008
Percentage of secondary schools that provided parents and families with health information to increase parent and family knowledge of physical activity Newark Detroit Philadelphia Chicago San Francisco Baltimore 19% - 42% Washington D.C. Fresno 43% - 53% San Bernardino Memphis 54% - 63% Los Angeles Charlotte- Mecklenburg County Albuquerque 64% - 80% San Diego No Data Houston Orange County Palm Beach County Hillsborough County Broward County Miami School Health Profiles, 2008
Percentage of secondary schools that used the School Health Index or a similar self-assessment tool to assess their policies, activities, and programs in physical activity Newark Detroit Philadelphia Chicago San Francisco Baltimore 24% - 35% Washington D.C. Fresno 36% - 47% San Bernardino Memphis 48% - 53% Los Angeles Charlotte- Mecklenburg County Albuquerque 54% - 81% San Diego No Data Houston Orange County Palm Beach County Hillsborough County Broward County Miami School Health Profiles, 2008
Percentage of secondary schools that prohibited all tobacco use at all times in all locations* Newark Detroit Philadelphia Chicago San Francisco Baltimore 18% - 38% Washington D.C. Fresno 39% - 50% San Bernardino Memphis 51% - 63% Los Angeles Charlotte- Mecklenburg County Albuquerque 64% - 98% San Diego No Data Houston Orange County Palm Beach County Hillsborough County Broward County Miami *Prohibited the use of all tobacco, including cigarettes, smokeless tobacco, cigars, and pipes; by students, faculty and school staff, and visitors; in school buildings; outside on school grounds; on school buses or other vehicles used to transport students; and at off-campus, school-sponsored events; during school hours and non-school hours. School Health Profiles, 2008
Percentage of secondary schools that sometimes, almost always, or always required students who were caught smoking to participate in an assistance, education, or cessation program Newark Detroit Philadelphia Chicago San Francisco Baltimore 25% - 35% Washington D.C. Fresno 36% - 52% San Bernardino Memphis 53% - 63% Los Angeles Charlotte- Mecklenburg County Albuquerque 64% - 87% San Diego No Data Houston Orange County Palm Beach County Hillsborough County Broward County Miami School Health Profiles, 2008
Percentage of secondary schools that provided tobacco cessation services for students, faculty, and staff at school or through arrangements with providers not on school property Newark Detroit Philadelphia Chicago San Francisco Baltimore 10% - 23% Washington D.C. Fresno 24% - 26% San Bernardino Memphis 27% - 36% Los Angeles Charlotte- Mecklenburg County Albuquerque 37% - 61% San Diego No Data Houston Orange County Palm Beach County Hillsborough County Broward County Miami School Health Profiles, 2008
Percentage of secondary schools that posted signs marking a tobacco-free school zone Newark Detroit Philadelphia Chicago San Francisco Baltimore 45% - 58% Washington D.C. Fresno 59% - 69% San Bernardino Memphis 70% - 88% Los Angeles Charlotte- Mecklenburg County Albuquerque 89% - 96% San Diego No Data Houston Orange County Palm Beach County Hillsborough County Broward County Miami School Health Profiles, 2008
Percentage of secondary schools that taught 15 key tobacco-use prevention topics in a required course Newark Detroit Philadelphia Chicago San Francisco Baltimore 24% - 43% Washington D.C. Fresno 44% - 50% San Bernardino Memphis 51% - 61% Los Angeles Charlotte- Mecklenburg County Albuquerque 62% - 79% San Diego No Data Houston Orange County Palm Beach County Hillsborough County Broward County Miami School Health Profiles, 2008
Percentage of secondary schools in which the lead health education teacher received professional development during the two years before the survey on tobacco-use prevention Newark Detroit Philadelphia Chicago San Francisco Baltimore 6% - 38% Washington D.C. Fresno 39% - 45% San Bernardino Memphis 46% - 64% Los Angeles Charlotte- Mecklenburg County Albuquerque 65% - 84% San Diego No Data Houston Orange County Palm Beach County Hillsborough County Broward County Miami School Health Profiles, 2008
Percentage of secondary schools that gathered and shared information with students and families about media or community-based tobacco-use prevention efforts during the two years before the survey Newark Detroit Philadelphia Chicago San Francisco Baltimore 31% - 36% Washington D.C. Fresno 37% - 44% San Bernardino Memphis 45% - 53% Los Angeles Charlotte- Mecklenburg County Albuquerque 54% - 78% San Diego No Data Houston Orange County Palm Beach County Hillsborough County Broward County Miami School Health Profiles, 2008
Percentage of secondary schools that worked with local agencies or organizations on efforts to reduce tobacco use during the two years before the survey Newark Detroit Philadelphia Chicago San Francisco Baltimore 27% - 36% Washington D.C. Fresno 37% - 47% San Bernardino Memphis 48% - 59% Los Angeles Charlotte- Mecklenburg County Albuquerque 60% - 71% San Diego No Data Houston Orange County Palm Beach County Hillsborough County Broward County Miami School Health Profiles, 2008
Percentage of secondary schools that provided parents and families of students with health information to increase parent and family knowledge of tobacco-use prevention Newark Detroit Philadelphia Chicago San Francisco Baltimore 15% - 33% Washington D.C. Fresno 34% - 46% San Bernardino Memphis 47% - 49% Los Angeles Charlotte- Mecklenburg County Albuquerque 50% - 65% San Diego No Data Houston Orange County Palm Beach County Hillsborough County Broward County Miami School Health Profiles, 2008
Percentage of secondary schools that used the School Health Index or a similar self-assessment tool to assess their policies, activities, and programs in tobacco-use prevention Newark Detroit Philadelphia Chicago San Francisco Baltimore 19% - 29% Washington D.C. Fresno 30% - 40% San Bernardino Memphis 41% - 47% Los Angeles Charlotte- Mecklenburg County Albuquerque 48% - 64% San Diego No Data Houston Orange County Palm Beach County Hillsborough County Broward County Miami School Health Profiles, 2008
Percentage of secondary schools in which students could not purchase chocolate candy from vending machines or at the school store, canteen, or snack bar Newark Detroit Philadelphia Chicago San Francisco Baltimore 47% - 78% Washington D.C. Fresno 79% - 90% San Bernardino Memphis 91% - 94% Los Angeles Charlotte- Mecklenburg County Albuquerque 95% - 100% San Diego No Data Houston Orange County Palm Beach County Hillsborough County Broward County Miami School Health Profiles, 2008
Percentage of secondary schools in which students could not purchase other kinds of candy from vending machines or at the school store, canteen, or snack bar Newark Detroit Philadelphia Chicago San Francisco Baltimore 39% - 78% Washington D.C. Fresno 79% - 86% San Bernardino Memphis 87% - 92% Los Angeles Charlotte- Mecklenburg County Albuquerque 93% - 100% San Diego No Data Houston Orange County Palm Beach County Hillsborough County Broward County Miami School Health Profiles, 2008
Percentage of secondary schools in which students could not purchase salty snacks that are not low in fat* from vending machines or at the school store, canteen, or snack bar Newark Detroit Philadelphia Chicago San Francisco Baltimore 33% - 71% Washington D.C. Fresno 72% - 81% San Bernardino Memphis 82% - 86% Los Angeles Charlotte- Mecklenburg County Albuquerque 87% - 95% San Diego No Data Houston Orange County Palm Beach County Hillsborough County Broward County Miami *Such as regular potato chips. School Health Profiles, 2008
Percentage of secondary schools in which students could not purchase cookies, crackers, cakes, pastries, or other baked goods that are not low in fat from vending machines or at the school store, canteen, or snack bar Newark Detroit Philadelphia Chicago San Francisco Baltimore 43% - 69% Washington D.C. Fresno 70% - 78% San Bernardino Memphis 79% - 83% Los Angeles Charlotte- Mecklenburg County Albuquerque 84% - 91% San Diego No Data Houston Orange County Palm Beach County Hillsborough County Broward County Miami School Health Profiles, 2008
Percentage of secondary schools in which students could not purchase soda pop or fruit drinks that are not 100% juice from vending machines or at the school store, canteen, or snack bar Newark Detroit Philadelphia Chicago San Francisco Baltimore 33% - 75% Washington D.C. Fresno 76% - 86% San Bernardino Memphis 87% - 90% Los Angeles Charlotte- Mecklenburg County Albuquerque 91% - 94% San Diego No Data Houston Orange County Palm Beach County Hillsborough County Broward County Miami School Health Profiles, 2008
Percentage of secondary schools in which students could not purchase sports drinks* from vending machines or at the school store, canteen, or snack bar Newark Detroit Philadelphia Chicago San Francisco Baltimore 16% - 27% Washington D.C. Fresno 28% - 59% San Bernardino Memphis 60% - 78% Los Angeles Charlotte- Mecklenburg County Albuquerque 79% - 93% San Diego No Data Houston Orange County Palm Beach County Hillsborough County Broward County Miami *Such as Gatorade. School Health Profiles, 2008
Percentage of secondary schools that did not sell less nutritious foods and beverages* anywhere outside the school food service program Newark Detroit Philadelphia Chicago San Francisco Baltimore 24% - 52% Washington D.C. Fresno 53% - 71% San Bernardino Memphis 72% - 76% Los Angeles Charlotte- Mecklenburg County Albuquerque 77% - 85% San Diego No Data Houston Orange County Palm Beach County Hillsborough County Broward County Miami *Baked goods not low in fat, salty snacks not low in fat, chocolate candy, other kinds of candy, and soda pop or fruit drinks that are not 100% juice School Health Profiles, 2008
Percentage of secondary schools that always offered fruits or non-fried vegetables in vending machines or school stores, and during celebrations when foods and beverages are offered Newark Detroit Philadelphia Chicago San Francisco Baltimore 4% - 8% Washington D.C. Fresno 9% - 14% San Bernardino Memphis 15% - 19% Los Angeles Charlotte- Mecklenburg County Albuquerque 20% - 30% San Diego No Data Houston Orange County Palm Beach County Hillsborough County Broward County Miami School Health Profiles, 2008
Percentage of secondary schools that prohibited all forms of advertising and promotion of candy, fast food restaurants, or soft drinks in all locations* Newark Detroit Philadelphia Chicago San Francisco Baltimore 40% - 51% Washington D.C. Fresno 52% - 60% San Bernardino Memphis 61% - 71% Los Angeles Charlotte- Mecklenburg County Albuquerque 72% - 78% San Diego No Data Houston Orange County Palm Beach County Hillsborough County Broward County Miami *In school buildings; on school grounds, including on the outside of the school building, on playing fields, or other areas of the campus; on school buses or other vehicles used to transport students; and in school publications. School Health Profiles, 2008
Percentage of secondary schools that used at least three different strategies to promote healthy eating Newark Detroit Philadelphia Chicago San Francisco Baltimore 8% - 17% Washington D.C. Fresno 18% - 20% San Bernardino Memphis 21% - 26% Los Angeles Charlotte- Mecklenburg County Albuquerque 27% - 42% San Diego No Data Houston Orange County Palm Beach County Hillsborough County Broward County Miami School Health Profiles, 2008
Percentage of secondary schools that taught 14 key nutrition and dietary behavior topics in a required course Newark Detroit Philadelphia Chicago San Francisco Baltimore 25% - 47% Washington D.C. Fresno 48% - 56% San Bernardino Memphis 57% - 65% Los Angeles Charlotte- Mecklenburg County Albuquerque 66% - 81% San Diego No Data Houston Orange County Palm Beach County Hillsborough County Broward County Miami School Health Profiles, 2008
Percentage of secondary schools in which the lead health education teacher received professional development during the two years before the survey on nutrition and dietary behavior Newark Detroit Philadelphia Chicago San Francisco Baltimore 6% - 37% Washington D.C. Fresno 38% - 49% San Bernardino Memphis 50% - 59% Los Angeles Charlotte- Mecklenburg County Albuquerque 60% - 81% San Diego No Data Houston Orange County Palm Beach County Hillsborough County Broward County Miami School Health Profiles, 2008
Percentage of secondary schools that used the School Health Index or a similar self-assessment tool to assess their policies, activities, and programs in nutrition Newark Detroit Philadelphia Chicago San Francisco Baltimore 25% - 29% Washington D.C. Fresno 30% - 42% San Bernardino Memphis 43% - 49% Los Angeles Charlotte- Mecklenburg County Albuquerque 50% - 71% San Diego No Data Houston Orange County Palm Beach County Hillsborough County Broward County Miami School Health Profiles, 2008
School Health Coordination
Percentage of secondary schools that had a school health council, committee, or team that offers guidance on the development of policies or coordinates activities on health topics Newark Detroit Philadelphia Chicago San Francisco Baltimore 35% - 45% Washington D.C. Fresno 46% - 58% San Bernardino Memphis 59% - 69% Los Angeles Charlotte- Mecklenburg County Albuquerque 70% - 84% San Diego No Data Houston Orange County Palm Beach County Hillsborough County Broward County Miami School Health Profiles, 2008
Percentage of secondary schools that ever used the School Health Index or other self-assessment tool to assess their policies, activities, and programs in physical activity, nutrition, or tobacco-use prevention Newark Detroit Philadelphia Chicago San Francisco Baltimore 34% - 43% Washington D.C. Fresno 44% - 53% San Bernardino Memphis 54% - 57% Los Angeles Charlotte- Mecklenburg County Albuquerque 58% - 81% San Diego No Data Houston Orange County Palm Beach County Hillsborough County Broward County Miami School Health Profiles, 2008
Percentage of secondary schools that had a copy of their district’s wellness policy Newark Detroit Philadelphia Chicago San Francisco Baltimore 45% - 61% Washington D.C. Fresno 62% - 79% San Bernardino Memphis 80% - 90% Los Angeles Charlotte- Mecklenburg County Albuquerque 91% - 97% San Diego No Data Houston Orange County Palm Beach County Hillsborough County Broward County Miami School Health Profiles, 2008
Percentage of secondary schools that taught 11 key HIV, STD, and pregnancy prevention topics in a required course during grades 6, 7, or 8 Newark Detroit Philadelphia Chicago San Francisco Baltimore 9% - 49% Washington D.C. Fresno 50% - 59% San Bernardino Memphis 60% - 71% Los Angeles Charlotte- Mecklenburg County Albuquerque 72% - 100% San Diego No Data Houston Orange County Palm Beach County Hillsborough County Broward County Miami School Health Profiles, 2008
Percentage of secondary schools that taught 8 key HIV, STD, and pregnancy prevention topics in a required course during grades 9, 10, 11, or 12 Newark Detroit Philadelphia Chicago San Francisco Baltimore 31% - 74% Washington D.C. Fresno 75% - 81% San Bernardino Memphis 82% - 89% Los Angeles Charlotte- Mecklenburg County Albuquerque 90% - 100% San Diego No Data Houston Orange County Palm Beach County Hillsborough County Broward County Miami School Health Profiles, 2008
Percentage of secondary schools that taught 3 key topics related to condom use in a required course during grades 9, 10, 11, or 12 Newark Detroit Philadelphia Chicago San Francisco Baltimore 0% - 59% Washington D.C. Fresno 60% - 68% San Bernardino Memphis 69% - 82% Los Angeles Charlotte- Mecklenburg County Albuquerque 83% - 100% San Diego No Data Houston Orange County Palm Beach County Hillsborough County Broward County Miami School Health Profiles, 2008
Percentage of secondary schools that taught how to access valid and reliable health information, products, or services related to HIV, other STDs, and pregnancy in a required course Newark Detroit Philadelphia Chicago San Francisco Baltimore 46% - 66% Washington D.C. Fresno 67% - 78% San Bernardino Memphis 79% - 89% Los Angeles Charlotte- Mecklenburg County Albuquerque 90% - 100% San Diego No Data Houston Orange County Palm Beach County Hillsborough County Broward County Miami School Health Profiles, 2008
Percentage of secondary schools that deliver HIV, STD, and pregnancy prevention programs (including after school or supplemental programs) that meet the needs of ethnic/racial minority youth at high risk Newark Detroit Philadelphia Chicago San Francisco Baltimore 5% - 8% Washington D.C. Fresno 9% - 14% San Bernardino Memphis 15% - 24% Los Angeles Charlotte- Mecklenburg County Albuquerque 25% - 40% San Diego No Data Houston Orange County Palm Beach County Hillsborough County Broward County Miami School Health Profiles, 2008
Percentage of secondary schools in which the lead health education teacher received professional development during the two years before the survey on HIV prevention Newark Detroit Philadelphia Chicago San Francisco Baltimore 46% - 57% Washington D.C. Fresno 58% - 68% San Bernardino Memphis 69% - 79% Los Angeles Charlotte- Mecklenburg County Albuquerque 80% - 100% San Diego No Data Houston Orange County Palm Beach County Hillsborough County Broward County Miami School Health Profiles, 2008
Percentage of secondary schools in which the lead health education teacher received professional development during the two years before the survey on 4 key HIV prevention topics Newark Detroit Philadelphia Chicago San Francisco Baltimore 9% - 36% Washington D.C. Fresno 37% - 47% San Bernardino Memphis 48% - 57% Los Angeles Charlotte- Mecklenburg County Albuquerque 58% - 70% San Diego No Data Houston Orange County Palm Beach County Hillsborough County Broward County Miami School Health Profiles, 2008
Percentage of secondary schools in which the lead health education teacher received professional development during the two years before the survey on at least 6 of 11 key HIV prevention topics Newark Detroit Philadelphia Chicago San Francisco Baltimore 13% - 29% Washington D.C. Fresno 30% - 41% San Bernardino Memphis 42% - 54% Los Angeles Charlotte- Mecklenburg County Albuquerque 55% - 65% San Diego No Data Houston Orange County Palm Beach County Hillsborough County Broward County Miami School Health Profiles, 2008
Percentage of secondary schools with a gay/straight alliance or similar club Newark Detroit Philadelphia Chicago San Francisco Baltimore 22% - 24% Washington D.C. Fresno 25% - 33% San Bernardino Memphis 34% - 48% Los Angeles Charlotte- Mecklenburg County Albuquerque 49% - 87% San Diego No Data Houston Orange County Palm Beach County Hillsborough County Broward County Miami School Health Profiles, 2008
Percentage of secondary schools with a policy on students or staff who have HIV infection or AIDS that addresses attendance of students with HIV infection, procedures to protect HIV-infected students and staff from discrimination, and maintaining confidentiality of HIV-infected students and staff Newark Detroit Philadelphia Chicago San Francisco Baltimore 32% - 41% Washington D.C. Fresno 42% - 48% San Bernardino Memphis 49% - 55% Los Angeles Charlotte- Mecklenburg County Albuquerque 56% - 76% San Diego No Data Houston Orange County Palm Beach County Hillsborough County Broward County Miami School Health Profiles, 2008