Download
1 / 44
440 likes | 448 Vues
Non-LTE atmosphere calculations of the solar spectrum. Prof. Dr. Werner K. Schmutz Director PMOD/WRC Davos, Switzerland ISSI PROBA2 workshop, Bern 20-22 June 2006. Overview. Project overview: Variability of the Sun and Global Climate

E N D
Non-LTE atmosphere calculations of the solar spectrum Prof. Dr. Werner K. Schmutz Director PMOD/WRC Davos, Switzerland ISSI PROBA2 workshop, Bern 20-22 June 2006
Overview • Project overview: • Variability of the Sun and Global Climate • Observations of the Total (and Spectral) Solar Irradiance • Understanding the variabiltity of the Total Solar Irradiance (TSI) • UV model calculations • Understanding UV variability
Sun – Earth connection at PMOD/WRC • Theoreticalresearch project “Variability of the Sun and Global Climate in • collaboration with ETH Zürich • ExperimentalPMOD/WRC space experiments: • VIRGO/SoHO (1995-2007?) • PREMOS/PICARD (2008) • LYRA/PROBA2 (2007)
The Sun-Earth connection: what is the influence of the Sun on the climate? ? Graphics: Dr. J. Beer EAWAG, Switzerland
Variability of the Sun and Global ClimateProject organization phase II: 2006-2008 (phase I 2001-2005) Ph.D. student EAWAG 10Be reconstruction of TSI back in time Project Manager Dr. Eugene Rozanov Ph.D. student PMOD/WRC prediction of solar spectrum Ph.D. student PMOD/WRC CCM calculations Ph.D. student IACETH comparison with observations
Variability of the Sun and Global Climate • Aim: • Combine solar physics with GCM calculations • Search for mechanisms how the solar variations influences the terrestrial climate • Investigate past climate changes from the point of view of a possible variation of the solar irradiation
Variability of the Sun and Global Climate • Solar physics: • Understand the observed variability of the solar irradiation • Investigate the variability of the solar UV radiation • Reconstruct the solar irradiance variations for the past 20 years, 100 years, 400 years, (104 years, 106 years … )
Variability of the Sun and Global Climate • Global climate model calculations with interactive photochemistry (GCM + CTM CCM) : • expand existing troposphere-stratosphere-mesosphere version of GCM/PC to allow for a detailed spectral specification of the incident radiation • evaluate the effects of variations in spectral solar irradiance input on ozone and other trace gases
TSI (W/m2)Indices: RzAsMgIIF10.7 Graph: curtesy of N. Krivova
1995 1997 1999 2001 2003 2005 TSI cycle 23
1995 1997 1999 2001 2003 2005 Sunspot area cycle 23
TSI TSI As 1995 1997 1999 2001 2003 2005 TSI and Sunspot area cycle 23
Understanding the variabiltity of the Total Solar Irradiance (TSI) 3-component model:quiet sun — faculae — sun spots Thomas Wenzler, ETH-ZH + S. Solanki & N. Krivova (+ M. Schüssler), MPS (newer models based on 4 components)
3-component model: filling factors a observedKurucz ATLAS9 models for the intensity I q = quite sun s = sun spot f = faculae
facular and sunspot effective areas (1) MDI magnetogramm continuum intensity image August 30, 1996
facular and sunspot effective areas (1) maps for faculae for sunspots August 30, 1996: active region dominated by faculae
facular and sunspot effective areas (2) MDI magnetogramm continuum intensity image November 25, 1996
facular and sunspot effective areas (2) maps for faculae for sunspots November 25, 1996: faculae and sunspot extracted
Comparison with observations (1a) Fligge, Solanki Unruh 2000, A&A 353, 380
Comparison with observations (1b) Fligge, Solanki Unruh 2000, A&A 353, 380
Comparison with observations: cycle 21 – 23Wenzler et al. 2005, A&A in press
Comparison with observations (2):spectral variation between maximum and minimum Unruh, Solanki, Fligge 2000, A&A 345, 635 calculated Lean 1997
Comparison with observations (3):spectral variation between maximum and minimum
Understanding the UV variabiltity Modeling Variations of the Solar UV Spectrum with COSI Margit Haberreiter, Micha Schöll, Werner Schmutz + input from the 3 (4) –component model COSI: model atmosphere in spherical geometry and non-LTE level populations in this application: solar structure is input
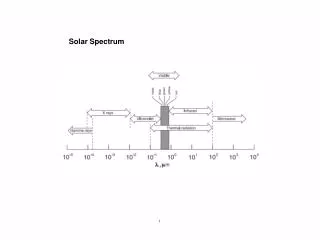
Synthetic solar spectrum Present status: ATLAS9: Kurucz LTE model fits the observations
A raising temperature structure beyond the minimum is needed ATLAS9: Kurucz LTE model fits the optical observations, but: non-LTE model is needed to calculate the UV spectrum (l < 200 nm)
In LTE, a raising temperature structure yields a much to strong UV radiation and UV variability
The problem to calculate a solar atmosphere non-LTE model is needed for the UV spectrum (l < 200 nm) Ok, no problem, but: Introduction of non-LTE affects also the visual and IR part of the spectrum!
The problem to calculate a solar atmosphere Introduction of non-LTE affects the visual and IR part of the spectrum! But, the spectrum is (obviously) also affected by: Temperature structure Abundances which have been thought to be known ...
The problem to calculate a solar atmosphere(work in progress) Introduction of non-LTE affects the visual and IR part of the spectrum! This requires to re-determine: Temperature structure Abundances
Comparison of the synthetic non-LTE COSI spectrum with SOLSPEC observations
Comparison of COSI results with observations:spectral variation between maximum and minimum
Correlation of spectral features strongest 2 principle components ( 90%) Axis1 = short time variability (27 days) Axis2 = long term variability (year) s = sun spot nr f F10.7 m MgII index Fig. from Dudok de Wit et al. Annales Geophysicae, 23, 3055–3069, 2005
Next step: Place the filling factors for faculae and sunspots Aim: Recon-struction of physical solar parameters Dudok de Wit, personal communication: LYRA filters 1-4
Conclusions • fractions of solar irradiance variations due to solar surface magnetism (lower limit estimates): • Solar rotation time scale: 90% • Activity cycle time scale: 90% • Secular (centuries) time scale: ? • Status: magnetic evolution can be modeled (contribution of other sources is unknown) • UV modeling • fair progress – not yet solved • UV influence on climate • ozone reaction understood • tropospheric climate response only about 50% of the estimated solar influence