Download

1 / 21
210 likes | 221 Vues
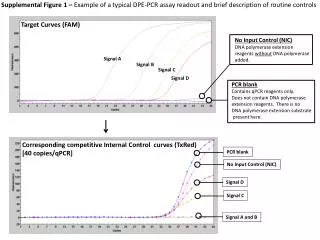
How to Quantify the Control Exerted by a Signal over a Target?. S. E. 1. I. E. Local Response: the sensitivity ( r ) of the level i to the preceding level i -1. Active protein forms ( E i ) are “communicating” intermediates:. 1. E. E. 2. 2. I. E.

E N D
How to Quantify the Control Exerted by a Signal over a Target? S E 1 I E Local Response: the sensitivity (r) of the level i to the preceding level i-1. Active protein forms (Ei) are “communicating” intermediates: 1 E E 2 2 I E System response equals the PRODUCT of local responses for a linear cascade: n - 1 I T T System Response: the sensitivity (R) of the target T to a change in the signal S Kholodenko et al (1997) FEBS Lett. 414: 430
Ultrasensitive Response of the MAPK Cascade in Xenopus Oocytes Extracts Is Explained by Multiplication of the Local Responses of the Three MAPK Levels James E. Ferrell, Jr. TIBS 21:460-466 (1996)
Ras f Raf Raf-P Feedbackstrength f = ln v/ ln[ERK-PP] MEK MEK-P MEK-PP Cascade with feedback Rf = R/(1 – fR) ERK ERK-P ERK-PP Control and Dynamic Properties of the MAPK Cascades Cascade response R = d ln[ERK-PP]/d ln[Ras] Cascade with no feedback R = r1 r2 r3 Kholodenko, B.N. (2000) Europ. J. Biochem. 267: 1583.
Effects of Feedback Loops on the MAPK Dynamics • Negative Feedback And Ultrasensitivity Can Cause Oscillations ERK-PP - red line ERK - green line • Positive Feedback Can Cause Bistability and Hysteresis Kholodenko, B.N. (2000) Europ. J. Biochem. 267: 1583 Multi-stability analysis: Angeli & Sontag, Systems & Control Letters, 2003 (in press)
Interaction Map of a Cellular Regulatory Network is Quantified by the Local Response Matrix A dynamic system: F = (f/x). The Jacobian matrix: Signed incidence matrix If fi/xj = 0, there is no connection from variable xj to xi on the network graph. Local response matrix r (Network Map) Relative strength of connections to each xi is given by the ratios, rij = xi/xj = - (fi/xj)/(fi/xi) r = - (dgF)-1F Kholodenko et al (2002) PNAS 99: 12841.
1 2 4 3 S System Responses are Determined by ‘Local’ Intermodular Interactions Rp= - r –1 rp= F–1(dgF)rp RP= x/p system response matrix; p – perturbation parameters (signals); r - local response matrix (interaction map); F = f/x the Jacobian matrix rP= f/p matrix of intramodular (immediate) responses to signals Bruggemanet al, J. theor Biol. (2002)
The goal is to determine Fi(t) = (Fi1 , … , Fin) the Jacobian elements that quantify connections to node i Untangling the Wires: Tracing Functional Interactions in Signaling, Metabolic, and Gene Networks Quantitative and predictive biology: the ability to interpret increasingly complex datasets to reveal underlying interactions However, at steady-state the F’s can only be determined up to arbitrary scaling factors Scaling Fij by diagonal elements, we obtain the network interaction matrix, r = - (dgF)-1F Problem: Network interaction map r cannot be captured in intact cells. Only system responses (R) to perturbations can be measured in intact cells.
Untangling the Wires: Tracing Functional Interactions in Signaling and Gene Networks. Solution:To Measure the Sytem Responses (matrix R) to Successive Perturbations to All Network Modules Steady-State Analysis: r = - (dg(R-1))-1R-1 Kholodenko et al, (2002) PNAS 99: 12841. Stark et al (2003) Trends Biotechnol. 21:290 Goal: To Determine and Quantify Unknown Network Connections
Testing the Method: Comparing Quantitative Reconstruction to Known Interaction Maps Problem: To Infer Connections in the Ras/MAPK Pathway Solution: To Simulate Global Responses to Multiple Perturbations and Calculate the Ras/MAPK Cascade Interaction Map Ras - Raf Raf-P MEK MEK-P MEK-PP + ERK ERK-P ERK-PP Kholodenko et al. (2002), PNAS 99: 12841.
Step 1: Determining Global Responses to Three Independent Perturbations of the Ras/MAPK Cascade. 1 2 3 b) Generation of the global response matrix 10% change in parameters 50% change in parameters a). Measurement of the differences in steady-state variables following perturbations:
Step 2: Calculating the Ras/MAPK Cascade Interaction Map from the System Responses Ras - Raf Raf-P MEK MEK-P MEK-PP + ERK ERK-P ERK-PP r = - (dg(R-1))-1R-1 Two interaction maps (local response matrices) retrieved from two different system response matrices Raf-P MEK-PP ERK-PP Raf-P MEK-PP ERK-PP Known Interaction Map Raf-P MEK-PP ERK-PP Raf-P MEK-PP ERK-PP
dx/dt = f(x,p) F(t) = (x/p) Perturbation in pj affects any nodes except node i. The goal is to determine Fi(t) = (1, Fi1 , … , Fin) the Jacobian elements that quantify connections to xi Vector Gj(t) contains experimentally measured network responses xi(t) to parameter pj perturbation, Gj(t) = (xi/t, xi , … , xn) Orthogonality theorem: (Fi(t),Gj(t)) = 0 Sontag E. et al. (submitted) A vector Ai(t) is orthogonal to the linear subspace spanned by responses to perturbations affecting either one or multiple nodes different from i Unraveling the Wiring Using Time Series Data
Inferring dynamic connections in MAPK pathway successfully Transition of MAPK pathway from resting to stable activity state Deduced time-dependent strength of a negative feedback for 5, 25, and 50% perturbations MAPK pathway kinetic diagram Sontag E. et al. (submitted)
Oscillatory dynamics of the feedback connection strengths is successfully deduced Ras f Raf Raf-P The Jacobian element F15 quantifies the negative feedback strength MEK MEK-P MEK-PP ERK ERK-P ERK-PP (red) - 1%,(black) - 10% perturbation Oscillations in MAPK pathway
Unraveling the Wiring of a Gene Network System Response Matrix Calculated Interaction Map Known Interaction Map Kholodenko et al. (2002) PNAS 99: 12841.
Unraveling The Wiring When Some Genes Are Unknown: The Case of Hidden Variables System Response Matrix Calculated Interaction Map Existing Network Kholodenko et al. (2002) PNAS 99: 12841.
Reverse engineering of dynamic gene interactions Fij = fi/xj
Effect of noise on the ability to infer network M. Andrec & R. Levy Probability of misestimating network connections as a function of noise level and connection strengths 1 r12 2 r13 3
Special Thanks to: Eduardo Sontag Michael Andrec Ronald Levy (Rutgers University, NJ, USA) Jan B. Hoek Anatoly Kiyatkin (Thomas Jefferson University, Philadelphia) Hans Westerhoff Frank Bruggeman (Free University, Amsterdam) Supported by the NIH/ NIGMS grant GM59570
A snapshot of the retrieved dynamics of gene activation and repression for a four-gene network Numbers on the top (with superscript a) are the correct “theoretical” values of the Jacobian elements Fij Numbers on the bottom (with superscript b) are the “experimental” estimates deduced using perturbations of the gene synthesis and degradation rates