Download
1 / 61
660 likes | 976 Vues
ELECTROCHEMISTRY CHEM 4700 CHAPTER 3. DR. AUGUSTINE OFORI AGYEMAN Assistant professor of chemistry Department of natural sciences Clayton state university. CHAPTER 3 CONTROLLED POTENTIAL TECHNIQUES. CONTROLLED POTENTIAL. - Electrostatic technique

E N D
ELECTROCHEMISTRYCHEM 4700CHAPTER 3 DR. AUGUSTINE OFORI AGYEMAN Assistant professor of chemistry Department of natural sciences Clayton state university
CHAPTER 3 CONTROLLED POTENTIAL TECHNIQUES
CONTROLLED POTENTIAL - Electrostatic technique - Measurement of the current response to an applied potential - Various combinations of potential excitations exist (step, ramp, sine wave, pulse strain, etc)
CHRONOAMPEROMETRY - Makes use of a stationary working electrode and an unstirred (quiescent) solution - Involves potential step of the working electrode from a value at which no faradaic reaction occurs to a value at which the surface concentration of the electroactive species is effectively zero - Current-time relation is monitored
CHRONOAMPEROMETRY - Diffusional mass transport and depletion of reactant is observed - Diffusion layer expands gradually - Concentration gradient close to the electrode surface decreases - Current decays with time as given by the Cottrell equation - Implies it1/2 is constant and is known as Cottrell behavior
CHRONOAMPEROMETRY Deviation from Cottrell Behavior - Occurs when t is greater than 100 seconds (due to natural convection effects from chemical reactions or use of non-planar electrodes or use of microelectrodes with high perimeter-to-area ratio) - Also occurs for short values of t (t < 50 ms) (additional background contribution of the charging current) Charging Current - Current required to charge the electrode-solution interface
CHRONOAMPEROMETRY Application - For measuring diffusion coefficient of electroactive species - For measuring the surface area of working electrode - Test strips for blood glucose applies chronoamperometry (potential step measurement) - Used to study mechanisms of electrode processes
CHRONOAMPEROMETRY Reversal Double Step Chronoamperometry - A second potential step is used to probe the fate of generated species from the first potential step Chronocoulometry - Charge-time dependence is monitored - Potential step experiment - The current resulting from the potential step is integrated to obtain charge (Q)
CHRONOAMPEROMETRY Chronocoulometry Qdl = correction for charge due to double-layer charging Qi = correction for charge due to adsorbed species - Useful for measuring the quantity of adsorbed reactants - A plot of Q versus t1/2 is known as Anson plot - Intercept at t = 0, Q = Qdl + Qi - Using a blank solution, intercept = Qdl
POLAROGRAPHY - Voltammetry in which the working electrode is dropping mercury - Makes use of potential ramp - Conventional DC - Wide cathodic potential range and a renewable surface - Hence widely used for the determination of many reducible species
POLAROGRAPHY - Initial potential is selected such that the reaction of interest does not take place - Cathodic potential scan is applied and current is measured - Current is directly proportional to the concentration-distance profile - Reduction begins at sufficiently negative potential [concentration gradient increases and current rises rapidly to its limiting value (id)] - Diffusion current is obtained by subtracting response due to supporting electrolyte (blank solution)
POLAROGRAPHY - Analyte species entering region close to the electrode surface undergo instantaneous electron transfer reaction - Maximum rate of diffusion is achieved - Current-potential plot provides polarographic wave (polarogram) - Drop area (A) is given by m = mass flow rate (g/s) and d = density of mercury (g/cm3)
POLAROGRAPHY The Ilkovic Equation D = cm2/s C = mol/cm3 m = g/s t = s id is current at the end of drop life The average current over drop life (iav)
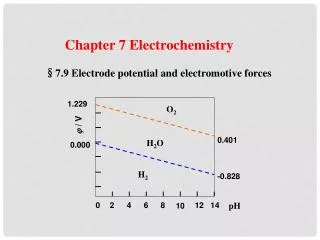
POLAROGRAPHY Half Wave Potential (E1/2) - Potential at which the current is one-half its limiting value - E1/2 is independent of concentration of species DR = diffusion coefficient of reduced species DO = diffusion coefficient of oxidized species - Experimental E1/2 is compared to literature values to identify unknown analyte
POLAROGRAPHY - n can be estimated using (holds for reversible processes) E3/4 = E for which i = 0.75id E1/4 = E for which i = 0.25id - Many polarographic processes are not reversible (processes involving organic compounds) - Waves are drawn out and current rise is not steep for nonreversible processes
PULSE VOLTAMMETRY - Voltammetric techniques which make use of potential pulse - A sequence of potential steps, each with a duration of about 50 ms, is applied to the working electrode After each potential step - charging current decays rapidly and exponentially to a neglible value - faradaic current decays slowly - Hence observed current late in the pulse life excludes charging current - Have low detection limits (10-8 M levels)
PULSE VOLTAMMETRY - There are different pulse voltammetric techques based on the excitation waveform and the current sampling regime - Normal-Pulse Voltammetry - Reverse-Pulse Voltammetry - Differential-PulseVoltammetry - Square-Wave Voltammetry - Staircase Voltammetry
PULSE VOLTAMMETRY Normal-Pulse Voltammetry - One potential pulse is applied for each drop of mercury when the DME is used - Consists of a series of pulses of increasing amplitude applied to successive drops at a preselected time near the end of each drop lifetime - Electrode is kept at a base potential between pulses at which no reaction occurs - Base potential is kept constant
PULSE VOLTAMMETRY Normal-Pulse Voltammetry Sample period Potential Step ∆E Pulse width ~50 ms Pulse amplitude Quiet time Base potential Pulse period Time
PULSE VOLTAMMETRY Normal-Pulse Voltammetry - Pulse amplitude increases linearly with each drop - Current is measured about 40 ms after each pulse is applied (at which time charging current is negligible) - Diffusion layer is thinner than that of DC polarography due to short pulse duration - Higher faradaic current than DC polarography
PULSE VOLTAMMETRY Normal-Pulse Voltammetry - Voltammogram has a sigmoidal shape - Limiting current (il) is given by tm = time after application of pulse when the current is measured
PULSE VOLTAMMETRY Normal-Pulse Voltammetry - Compared to current measured in DC polarography - Normal pulse is about 5-10 times more sensitive - Advantageous when using solid electrodes
PULSE VOLTAMMETRY Reverse-Pulse Voltammetry - The pulse sequence is a morror image of that of the normal-pulse voltammetry - The initial potential is on the plateau of the wave (where reduction occurs) - A series of positive pulses of decreasing amplitude is applied
PULSE VOLTAMMETRY Differential-Pulse Voltammetry - One potential pulse is applied for each drop of mercury when the DME is used - Small pulses of constant amplitude are superimposed on a linear potential ramp applied to the working electrode - Potentials are applied just before the end of each drop - Useful for measuring trace levels of organic and inorganic species
PULSE VOLTAMMETRY Differential-Pulse Voltammetry Potential Sample period Pulse amplitude Quiet time Time
PULSE VOLTAMMETRY Differential-Pulse Voltammetry Current is sampled twice - Just before the pulse application (i1) and late in the pulse life (after ~ 40 ms) when the charging current has decayed (i2) ∆i (= i2 – i1) is plotted against the applied potential and displayed (instrument does these) - The charging current contribution to the differential current is negligible - Detection limit is as low as 10-8 M (~ 1 μg/L)
PULSE VOLTAMMETRY Differential-Pulse Voltammetry The Voltammogram - Consists of current peaks - The height of peaks is directly proportional the concentration of analyte - The peak shaped response exhibits higher resolution than DC polarography - The peak potential (Ep) occurs near the polarographic half-wave potential and can be used to identify the species
PULSE VOLTAMMETRY Differential-Pulse Voltammetry ∆E = pulse amplitude The width at half-height of the peak (W1/2) If n = 1, W1/2 ≈ 90.4 mV at 25 oC
PULSE VOLTAMMETRY Differential-Pulse Voltammetry - Useful for analysis of mixtures - Larger pulse amplitudes result in larger and broader peaks - Pulse amplitudes of 25-50 mV with scan rate of 5 mV/s is commonly employed - Irreversible redox systems produce lower and broader peaks than reversible systems - Used to provide information about chemical form of analyte
PULSE VOLTAMMETRY Square-Wave Voltammetry - Large amplitude differential technique - The wave form applied to the working electrode is a symmetric square wave superimposed on a base staircase potential - Current is sampled twice during each square-wave cycle - One at the end of the forward pulse (i1) and one at the end of the reverse pulse (i2) - This results in square-wave modulation
PULSE VOLTAMMETRY Square-Wave Voltammetry Potential Sample period i1 Amplitude (E) ∆E i2 Time
PULSE VOLTAMMETRY Square-Wave Voltammetry - Modulation amplitude is very large - Reverse pulses cause the reverse reaction of any product formed from the forward pulse - The net current (i1 – i2) is then plotted versus the base staircase potential - This gives the peak-shaped voltammogram
PULSE VOLTAMMETRY Square-Wave Voltammetry Reversible System - The peak-shaped voltammogram is symmetric about the half-wave potential - Peak current is proportional to the concentration - The net current is larger than the forward or reverse currents
PULSE VOLTAMMETRY Square-Wave Voltammetry - Higher sensitivity than differential-pulse in which reverse current is not used (currents 4 times higher for reversible systems) (currents are 3.3 times higher for irreversible systems) - Low detection limits up to 10-8 M - Reduced analysis time due to higher scan rates (few seconds compared to ~3 minutes for differential pulse)
PULSE VOLTAMMETRY Square-Wave Voltammetry - Entire voltammogram is recorded on a single mercury drop - Effective Scan Rate = f∆Es f = square-wave frequency ∆Es = step height - May be used for kinetic studies
PULSE VOLTAMMETRY Staircase Voltammetry - Useful for rejecting background charging current - Potential-time waveform involves successive potential steps of ~10 mV in height and ~50 ms duration - Current is measured at the end of each step where the charging current is negligible (has decayed) - Peak-shaped current response is similar to that of linear scan experiments (considered as digital version of linear scan)
PULSE VOLTAMMETRY Staircase Voltammetry Potential Sample period Step Width Step height (∆E) Time
PULSE VOLTAMMETRY Cyclic Staircase Voltammetry - The direction of potential steps is reversed at a switching potential - Voltammetric response is similar to cyclic voltammetry - Charging current contribution is much reduced
AC VOLTAMMETRY - Alternating current frequency-domain technique - Involves the superimposition of a small amplitude AC voltage on a linear ramp - Frequency is usually between 50 and 100 Hz - Amplitude between 10 and 20 mV Potential Time
AC VOLTAMMETRY - AC signal causes perturbation in the surface concentration - AC current is plotted against potential - Peak potential is the same as that of the polarographic half-wave potential - Useful for the study of electron processes - Suitable for fast electron transfer kinetics
AC VOLTAMMETRY ∆E = amplitude - Peak height is proportional to analyte concentration - Peak height is proportional to square root of frequency (ω) for reversible systems - Peak with is independent of frequency = 90.4/n mV at 25 oC
STRIPPING ANALYSIS Two step technique Deposition Step - Preconcentration step - Involves the electrolytic deposition of a small portion of metal ions in solution into a mercury electrode Stripping Step - Measurement step - Involves the dissolution (stripping) of the deposit
STRIPPING ANALYSIS - Very sensitive for detection of trace metals - Favorable signal to background ratio - About four to six metals can be measured simultaneously at levels as low as 10-10 M - Low cost instrumentation - There are different versions of stripping analysis depending on the nature of the deposition and stripping steps
STRIPPING ANALYSIS Anodic Stripping Voltammetry (ASV) - The most widely used stripping analysis - Preconcentration is done by cathodic deposition at controlled potential and time - Metals are preconcentrated by electrodeposition into a small-volume Hg electrode - Deposition potential is usually 0.3 – 0.5 V more negative than Eo for the analyte metal ion
STRIPPING ANALYSIS Anodic Stripping Voltammetry (ASV) - Metal ions reach the Hg electrode surface by diffusion and convection - Electrode rotation or solution stirring is employed to achieve convection - Metal ions are reduced and concentrated as amalgams Mn+ + ne- + Hg → M(Hg)
STRIPPING ANALYSIS Anodic Stripping Voltammetry (ASV) - Hg film electrodes or Hg drop electrodes may be used - Only solution stirring is employed with Hg drop electrodes - Quiescent solutions can be used with Hg ultramicroelectrodes CHg = concentration of metal in the amalgam il = limiting current td = deposition period VHg = volume of Hg electrode
STRIPPING ANALYSIS Anodic Stripping Voltammetry (ASV) Following preselected deposition period: - Forced convection is stopped - Anodic potential scan is employed (may be linear or pulse) - Amalgamated metals are reoxidized (stripped off electrode) - An oxidation (stripping) current then flows M(Hg) → Mn+ + ne- + Hg
STRIPPING ANALYSIS Anodic Stripping Voltammetry (ASV) - Stripping voltammogram is current-potential plot showing peaks for metal ions present - Peak potentials are used to identify metals in sample - Hg film is more sensitive and more efficient in preconcentration than Hg drop (due to higher surface:volume ratio) - Hg film gives sharper peaks and improved resolution for mixtures - Bismuth and gold electrodes may also be used
STRIPPING ANALYSIS Anodic Stripping Voltammetry (ASV) - Peak current for Hg film electrode is given by - Peak current for Hg drop electrode is given by A = area of film l = thickness of film ν = scan rate during stripping
STRIPPING ANALYSIS Cathodic Stripping Voltammetry (CSV) - Mirror image of ASV - Involves anodic deposition of analyte and subsequent stripping by a potential scan in the negative direction An- + Hg ↔ HgA + ne- (Deposition to the right and stripping to the left) - Useful for measuring organic and inorganic compounds that form insoluble salts with Hg (thiols, penicillin, halides, cyanides)