Download
1 / 26
260 likes | 374 Vues
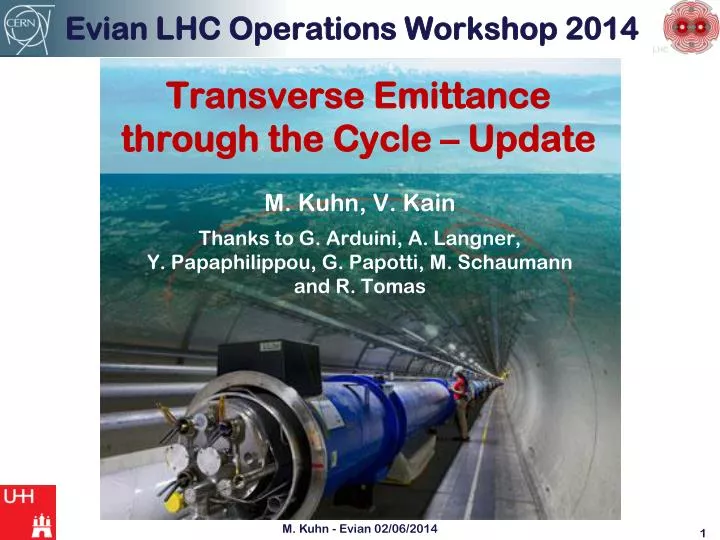
Evian LHC Operations Workshop 2014. Transverse E mittance through the Cycle – Update. M. Kuhn, V. Kain Thanks to G. Arduini, A. Langner, Y. Papaphilippou, G. Papotti, M. Schaumann and R. Tomas. Motivation: 2012 Emittance Blow-up.

E N D
Evian LHC Operations Workshop 2014 Transverse Emittance through the Cycle – Update M. Kuhn, V. Kain Thanks to G. Arduini, A. Langner, Y. Papaphilippou, G. Papotti, M. Schaumann and R. Tomas M. Kuhn - Evian 02/06/2014
Motivation: 2012 Emittance Blow-up • Overall average transverse normalized emittance blow-up through the LHC cycle: • ~ 0.4 – 0.9 mm from injection into the LHC to start of collision (convoluted e) for the first injected batch of 144 bunches per beam • Convoluted e: • Collision values from ATLAS bunch luminosity (similar for CMS values) • Injection values from LHC wire scanners • Average of first 144 bunch batch After Technical Stop 3 (TS3): very high brightness beams from the LHC injectorslead to even larger emittance growth! M. Kuhn - Evian 02/06/2014
Instrumentation and b Measurements M. Kuhn - Evian 02/06/2014 • 2012 available transverse profile monitors through the cycle: • ONLY WIRE SCANNERS! • Could only measure low intensity test fills, no physics fills • Influence of gain and filters on obtained beam sizes, not possible to obtain optimum settings and thus optimum beam sizes values [1] • Transverse beam sizes obtained from 5 parameter Gauss fit of the core of the profile (80 % intensity cut) • b functions from turn-by-turn phase advance measurement [2] • At injection, at discrete energies during the ramp, at flattop energy and after the b* squeeze • Linear interpolation between the measurement points • Values transported to location of wire scanners and experiments • Example: Fill 3217 (25. Oct. 2012) • 2 batches of 6 bunches, 50 ns bunch spacing • Bunch intensity ~ 1.6 x 10¹¹ ppb, (4 s) bunch length ~ 1.2 ns • Caveat: fill after LHC octupole polarity swap, thus large growth during b* squeeze!
Emittances through the 2012 LHC Cycle M. Kuhn - Evian 02/06/2014 • Conclusions from wirescanner measurements: • Emittances are mainly growing during injection plateau and ramp • Sometimes shrinking emittances during the ramp (beam 1) • Sometimes large blow-up at the end of squeeze • Sources of emittance blow-up: • Injection: intra beam scattering (IBS) and 50 Hz noise [1] • Ramp: probably only IBS • Growing- shrinking emittances due to non-monotonic changes of optics at wire scanners • Squeeze: probably beam instabilities • Blow-up in the vertical planes at injection and ramp from coupling
Non-Physical Emittance Evolution during Ramp • New beta function analysis for values through the ramp • Growing- shrinking emittances due to non-monotonic changes of optics at wire scanners • Same for B1H • Not enough b measurements to remove all “non-physical” points • Monotonic growth of beta function at wire scanner No shrinkage! • Same for B2V M. Kuhn - Evian 02/06/2014
IBS during the LHC Ramp Beam 2: Simulation matches measurement! Bunch lengths and intensities similar for both batches, but different initial emittances Almost same growth in IBS simulation (4 - 5 %) • Emittance growth in the horizontal planes during the LHC energy ramp probably only from IBS • For test fills ~ 3 - 5 % growth through the ramp depending on initial beam parameters • First guess for physics fills: ~ 3 - 5 % ( mm) growth through the ramp M. Kuhn - Evian 02/06/2014 Comparison of emittance measurement during the ramp with wire scanners and IBS simulations with MADX [3]
IBS during the LHC Cycle IBS simulations and wire scanner measurements for B2H compatible! M. Kuhn - Evian 02/06/2014 • Example: Fill 3217 beam 2 horizontal • Monotonic optics changes for B2H during the LHC cycle • Linear interpolation of bgives reasonable values and thus emittances • Full IBS simulation during the entire LHC cycle compared to wire scanner measurements
IBS during Stable Beams (1) 2011/ beginning of 2012 • For later fills: • larger e0 • Different growth econv from luminosity vs. simulated eH from MADX and CTE Simulation does not match measurement! Measured blow-up ~ 2x larger than IBS simulated horizontal growth! End of 2012 M. Kuhn - Evian 02/06/2014 • Comparing emittances of “good” fills to IBS simulations • from 2011 and 2012 (before and after octupole polarity switch) • Long fills with stable bunches (cleaned data) • Caveat: large uncertainty about initial horizontal emittance!
IBS during Stable Beams (2) Horizontal: Simulation matches measurement! For this fill almost 40 % blow-up in only 2 hours! Vertical: What causes the blow-up? Almost the same growth as in horizontal plane. Batch 3 non colliding Batch 4 colliding IP1/5 M. Kuhn - Evian 02/06/2014 • Comparing emittances of MD Fill 3160 to IBS simulations (MADX) • Caveat: only 2 h stable beams, short bunch length, small emittance
Outlook LHC Run 2 M. Kuhn - Evian 02/06/2014 • Simulated emittance growth for beams in 2015 • 20 min ramp to 6.5 TeV (RF 6 - 12 MV, 95 % transmission) • assuming injection and flattop plateau length are the same as in 2012 • Estimated emittance blow-up in the horizontal plane from IBS during cycle and collisions (similar as in 2012): High brightness beams will suffer severely from IBS!
Emittance Measurement Puzzle M. Kuhn - Evian 02/06/2014 • Large discrepancy between wire scanner and ALTAS/CMS/LHCb emittances during collisions • Measured emittance with wire scanners during collisions at test fills • Compared to emittance from ATLAS/CMS luminosity (e.g. Fill 3217) Wire scanner results much smaller than ATLAS/CMS results! • Also compared to LHCb emittances measured with beam-gas interactions (SMOG [4], Fill 3160) LHCb delivers smaller or larger emittances, depending on the beam and plane with a difference up to 0.6 mm • Mostly emittance values from LHCb are smaller than ATLAS/CMS values and larger than the wire scanner ones
New IR4 Optics for LHC Run 2 • Wire Scanner and BSRT better measurement accuracy • BGI possible applicability during Run 2 M. Kuhn - Evian 02/06/2014 • At 6.5 TeV beam sizes will be very small: affects emittance measurement accuracy! • Increase b at transverse profile monitors to increase beam size • Option max: overall new optics, ATS-compatible [5,6] • Expected beam size improvements with new optics: • At 6.5 TeV with 1.7 mm emittance • In 2012 measured beam sizes 200 - 400 mm at 4 TeV with WS Advantages:
Plans For the Start Up in 2015 M. Kuhn - Evian 02/06/2014 • Essential: optics measurements with AC dipole and k-modulation • Tools will be available • Calibration of all transverse profile monitors at the start of Run 2! • Quantify wire scanner photomultiplier saturation • Cross calibration: wire scanner, BSRT, BGI, BGV • BGV: demonstrator Beam Gas Vertex Detector for LHC beam 2 • Comparison of wire scanner, luminosity and SMOG during Van der Meer scans at the beginning of Run 2 • Measurements with few bunches during the entire cycle including stable beams • Comparison of wire scanner, BSRT, BGI and BGV if possible • Lumi scans at the end of physics fills if possible (as in 2011)
Thank you for your attention.Questions? M. Kuhn - Evian 02/06/2014
Literature M. Kuhn - Evian 02/06/2014 [1] M. Kuhn, “Emittance Preservation at the LHC,” Master Thesis, University of Hamburg/CERN, Geneva, Switzerland 2013. [2] A. Langner, “Improvements in the Optics Measurement Resolution for the LHC,” to be published at IPAC14. [3] http://mad.web.cern.ch/mad/ [4] C. Barschel, “Precision luminosity measurement at LHCb with beam-gas imaging, ” Ph.D. Thesis, RWTH Aachen University, 2013. [5] S. Fartoukh, “Optics change requests for Run II and possible options for 2015,” LMC Meeting # 179, April 30, 2014. [6] G. Trad, “Implications on beam size measurements in IR4,” LBOC Meeting #17, April 15, 2014. [7] M. Kuhn, “Update on emittance analysis,” LBOC Meeting #11, January 28, 2014.
Additional Slides M. Kuhn - Evian 02/06/2014
Emittance through 2012 LHC Cycle M. Kuhn - Evian 02/06/2014
Emittance vs. Beta Function – B1H M. Kuhn - Evian 02/06/2014 Growing- shrinking emittances due to non-monotonic changes of optics at wire scanners. Even more obvious for B1 V, next slide. • Not enough beta-measurements to remove all “non-physical” points
Emittance vs. Beta Function – B2V M. Kuhn - Evian 02/06/2014 Monotonic growth of beta function at wire scanner no shrinkage
ATLAS/CMS vs. Wire Scanner M. Kuhn - Evian 02/06/2014 • Example: low intensity test Fill 3217 • Injection values measured with wire scanners • Gauss fit of the entire transverse profile • Collision values measured with wire scanners and obtained from ATLAS and CMS bunch luminosity • Average value of 6 colliding bunches • Wire scanner results much smaller than ATLAS/CMS results! • Similar for other test fills measured in 2012
SMOG vs. Wire Scanner Discrepancy up to 0.6 mm, but no systematic difference between wire scanner and LHCb emittances! M. Kuhn - Evian 02/06/2014 • Measurements during 30 min in collisions with beam gas interactions in LHCb (SMOG) [4] and wire scanners • Average emittances of 6 bunches per batch
Fill 3217 ATLAS/CMS Luminosity Fill 3217 6 bunches (batch 2) colliding. Black line indicates peak luminosity taken for emittance calculation. M. Kuhn - Evian 02/06/2014 Rather large discrepancy between ATLAS and CMS emittance values from luminosity Closer look at specific luminosity reveals different results for ATLAS and CMS
Fill 3160 – LHC Cycle M. Kuhn - Evian 02/06/2014
IBS during Stable Beams (2) Simulation does not match measurement! Measured blow-up is almost twice as larger as simulated horizontal growth from IBS! M. Kuhn - Evian 02/06/2014 • Comparing emittances of “good” fills to IBS simulations • from 2011 and 2012 (before and after octupole polarity switch) • Long fills with mostly stable bunches (cleaned data)
IBS during Stable Beams (2) Horizontal: Simulation matches measurement! For this fill almost 40 % blow-up in only 2 hours! Vertical: What causes the blow-up? Almost the same growth as in horizontal plane. Batch 3 non colliding Batch 4 colliding IP1/5 M. Kuhn - Evian 02/06/2014 • Comparing emittances of MD Fill 3160 to IBS simulations (MADX) • Caveat: only 2 h stable beams, short bunch length, small emittance
New IR4 Optics for LHC Run 2 • WS and BSRT better measurement accuracy • BGI possible applicability during Run 2 M. Kuhn - Evian 02/06/2014 • At 6.5 TeV beam sizes will be very small: affects emittance measurement accuracy! • Increase b at transverse profile monitors to increase beam size • Option max: overall new optics, ATS-compatible [6,7] • Expected beam size improvements with new optics: • At 6.5 TeV with 2mm emittance • In 2012 measured beam sizes 200 - 400 mm at 4 TeV with WS Advantages: