Download

1 / 28
280 likes | 392 Vues
Pentti Minkkinen. Lappeenranta University of Technology. e-mail: Pentti.Minkkinen@lut.fi. Weighting Error – the Often Neglected Component of the Total Sampling Error. WSC 5. Global Estimation Error GEE. Total Sampling Error T S E. Total Analytical Error TAE. Point Materialization Error

E N D
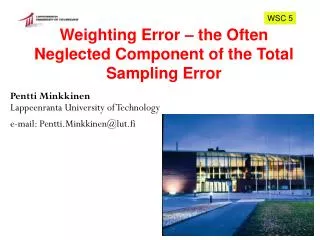
Pentti Minkkinen Lappeenranta University of Technology e-mail: Pentti.Minkkinen@lut.fi Weighting Error – the Often Neglected Component of the Total Sampling Error WSC 5
Global Estimation Error GEE Total Sampling Error TSE Total Analytical Error TAE Point Materialization Error PME Weighting Error SWE Increment Extraction Error IXE Increment Delimi- tation Error IDE Increment and Sample Preparation Error IPE Point Selection Error PSE Long Range Point Selection Error PSE1 Periodic Point Selection Error PSE2 Grouping and Segregation Error GSE Fundamental Sampling Error FSE GEE=TSE +TAE TSE= (PSE+FSE+GSE)+(IDE+IXE+IPE)+SWE Error components of analytical determination according to P.Gy
Weighting error • Weighting error is made in the estimation of simple arithmetic mean, when • the sampling target consists of several sub-strata of different sizes • in process analysis, when the flow-rate varies
Lot Consisting of Strata of Different Sizes and Heterogeneities Lot consisting of k strata of different sizes and the quantities needed to optimize the sampling plan
= Relative size of the stratum i (1) Ni= Relative size of stratum i expressed as the number of potential samples that could be taken from a strata = , MSi is the size of samples taken from stratum i. nt = Total number of samples analyzed = = Mean of stratum i (2) MLi = sizes of strata (e.g. as mass or volume), (i = 1,2, …, k) si = Standard deviation of one sample taken from stratum i ci = Cost of one sample analyzed from stratum i ct = Total cost of the estimation of the grand mean of the lot ni = No. of samples taken from stratum i
= Grand mean of the lot (2) (3a) Variance of the lot mean = If the samples taken are small in comparison to the stratum size (as is usually the case) this equation simplifies to , if in all strata ni << Ni and Ni>> 1 (3b) Total cost of the investigation in general case is (4a) Usually the costs are independent of strata, and (4b) , if
(5) , where a) Optimal allocation of samples, if only the relative sizes Wiof the strata are known If only the sizes of strata are known and the total cost ct of the investigation is fixed, then the best strategy is to allocate the samples proportionally to the sizes of strata: Both nt and ni have to be rounded to integers so that the total cost will not be exceeded.
b) Optimal allocation of samples, when the target value, cT, is given to the total cost and the variance of the lot mean has to be minimized (6) Here, too,ni’s have to rounded into integers so that the target cost is not exceeded.
c) Optimal allocation of samples, when the target value, sT, is given to the standard deviation of the lot mean and total cost has to be minimized (7) Again, ni’s have to be rounded to integers so that the required standard deviation of the lot mean will not be exceeded.
Sampling error in process analysis • In process analysis the fluctuation of the flow-rate should be taken into account in estimating the mean over a time
Cutter movement Incorrect sample delimitation Incorrect sample profile
Cutter movement Correct sample delimitation Correct sample profiles
v a b c Correct design for proportional sampler:correct increment extraction v= constant 0.6 m/s if d > 3 mm, b 3d = b0 ifd < 3 mm,b 10 mm = b0 d = diameter of largest particles b0 = minimum opening of the sample cutter
Proportional sampling • Correctly executed proportional sampling eliminates the weighting error, if each sample is weighed and the mean is calculated as weighted mean by using the sample masses as weights. • Subsamples have to be sampled proportionally, if they are combined into a composite sample
Effect of density • If the density of the material varies within the lot and equal volumes are sampled the simple mean is erroneous
Example on weighting error: Drill core of stratified rock type Total mass of the drill core: Mtot=152.8 kg Mass of the valuable mineral = 47.5 kg Density of the valuable mineral = 5 kg/dm3 Density of the gangue = 2.6 kg/dm3 Average density = 3.056 kg/dm3 True mass fraction of the mineral = 47.5kg/(152.8 kg) = 0.3109 = 31.09 % SAMPLING PLAN: The drill core is divided into 100 slices of equal sizes, volume = 0,5 dm3 and average mass, Ms =1.528 kg
Example on weighting error(cont.) • Each sample is analyzed separately. The mean concentration as mass fraction, cm = 0.190 • Based on this result the average mass of the valuable mineral in the core is = cm ·Ms ·100=29.03 kg • If every sample is weighed (mass Mi) and the weighted mean of the mass fraction is estimated the correct mean concentration is obtained: • and the total mass of the valuable mineral • Relative weighting error is thus: • (0.19-0,3109)/0.3109 = -0.389 = -39,9 % The drill core is divided into 100 slices of equal sizes, volume = 0,5 dm3 and average mass, Ms =1.528 kg
20 samples, 1 dm3 by volume analysed Correct mean = 0.3109 = 31,09 %
Process sampling: Simulation study Three processes with 1000 data points were generated with low medium and high correlation between concentration and flow-rate
r = 0.011 8 6 ai 4 2 0 25 30 35 40 45 50 55 60 65 Flow-rate 4 2 ai, Vi 0 -2 -4 0 100 200 300 400 500 600 700 800 900 1000 Sample No. Weighted mean Simple mean Relat. Error (%) All sampled 45.3669 45.3429 -0.053 Every tenth sampled 45.5452 0.3929 Every tenth sampled 45.4100 0.0948
r = -0.558 20 15 ai 10 5 0 25 30 35 40 45 50 55 60 65 Flow-rate 2 0 -2 -4 0 100 200 300 400 500 600 700 800 900 1000 ai, Vi Sample No. Weighted mean Simple mean Relat. Error (%) All sampled 43.3210 45.3429 4.67 Every tenth sampled 43.4187 0.225 Every tenth sampled 45.4100 4.82
r = 0.972 80 60 ai 40 20 25 30 35 40 45 50 55 60 65 Flow-rate 4 2 0 -2 -4 0 100 200 300 400 500 600 700 800 900 1000 ai, Vi Sample No. Weigted mean Simple mean Relat. Error (%) All sampled 47.1692 45.3429 -3.87 Every tenth sampled 47.2751 0.225 Every tenth sampled 45.4100 -3.73
Second simulation Correl. Weighted Simple Rel. Error coefficient mean mean % 0.0248 36.1798 36.1346 -0.125 0.169 36.6219 36.1346 -1.33 0.971 37.5777 36.1346 -3.84
Weighting error: calculation of mean when flow-rate varies 350 300 250 NOx (mg/m3) 200 150 100 0 100 200 300 400 500 600 700 800 5 x 10 3.5 3 2.5 FLOWRATE (m3/h) 2 1.5 1 0 100 200 300 400 500 600 700 800 Time (h) NOx concentrations and total gas flow-rate measured as one-hour averages from a power plant during one month
Mean of NOxconcentrations: 229.5 mg/m3 Mean of gasflow-rate : 2.327 ·105 m3/h Total gasflow: 1.718·108 m3 Total NOxemitted (unweighted): 39400 kg å ciVi Weighted mean of NOxconcentration: = 237.5 mg/m3 å Vi Total NOxemitted (weighted): 40800 kg CALCULATION OF TOTAL MONTHLY NOx EMISSION Weighting error of simple mean: in mean concentration = -7.97 mg/m3 in total monthly emission = -1400 kg
Minimization of weighting error in Process analysis, when proportional cross-steam sampling cannot be used • Flow-rate is measured simultaneously with sampling and used as weight in calculating the mean. • Sampling system is coupled to a flow meter so that a fixed volume is taken when the required total volume has passed the sampling point. In this case the simple average can be used as the mean concentration.
CONCLUSIONS Weighting error is often a significant component of sampling errors and has to taken into account when the average value, mean concentration or total mass of analyte in the sampling target is estimated. Increasing the No. of samples does not necessarily reduce the sampling error, if the flow-rate and concentration are correlated.