Download
1 / 7
90 likes | 419 Vues
Analyzing Contour Plots. Contour farming is a regular part of farming, especially in China and other rugged countries. Daily Applications. Weather Maps! Temperature P ressure Wind. Contours in Many Places.

E N D
Analyzing Contour Plots Contour farming is a regular part of farming, especially in China and other rugged countries.
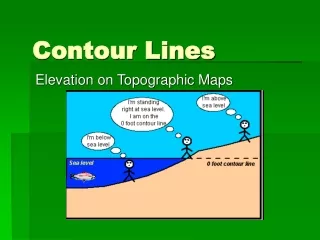
Daily Applications Weather Maps! • Temperature • Pressure • Wind
Contours in Many Places Lest we think this is just for farming, weather, and such, notice that the frequencies of vibrations of a violin can be shown with contours.
Contours in Business Contour plot of a monopoly broker's profit function and broker clients' indifference curves (IC1,...,3). Take look at this business application. It found in a very esoteric business paper. Here’s the link to the Paper. Don’t look at it unless you really want to see where calculus is applied in business theory.
Contours and Number Grids Contours can be integrated with a number grid to get the “picture” a little better. Notice that the contours lead your eye to an extreme, in this case a maximum, within the number grid. While there is no particular application to this plot, the shape is similar enough to the profit plot, it might be extracted from it.
Analyzing Contour Plots This lesson continues with a series of contour plot examples showing how we can visual a variety of plots.