Download
1 / 35
360 likes | 487 Vues
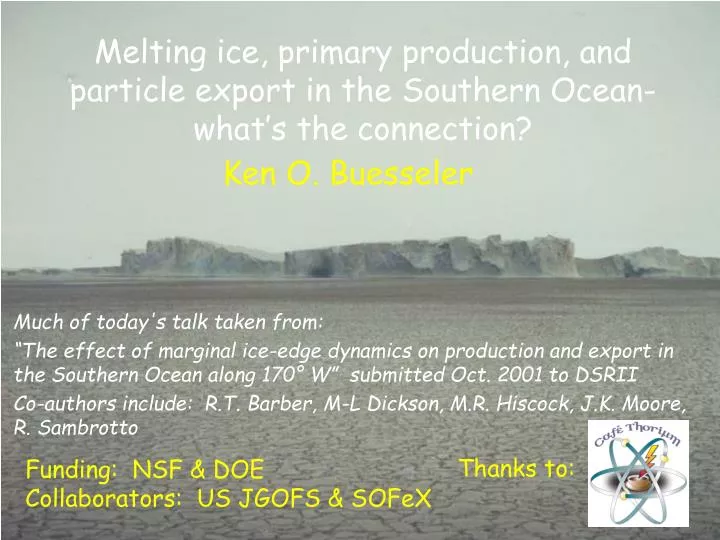
Melting ice, primary production, and particle export in the Southern Ocean- what’s the connection?. Ken O. Buesseler. Much of today's talk taken from: “The effect of marginal ice-edge dynamics on production and export in the Southern Ocean along 170° W” submitted Oct. 2001 to DSRII

E N D
Melting ice, primary production, and particle export in the Southern Ocean- what’s the connection? Ken O. Buesseler Much of today's talk taken from: “The effect of marginal ice-edge dynamics on production and export in the Southern Ocean along 170° W” submitted Oct. 2001 to DSRII Co-authors include: R.T. Barber, M-L Dickson, M.R. Hiscock, J.K. Moore, R. Sambrotto Thanks to: Funding: NSF & DOE Collaborators: US JGOFS & SOFeX
Outline • Southern Ocean: background • Synthesis US JGOFS Antarctic Environment and Southern Ocean Process Study (AESOPS) • 4 cruise summary- 1997/1998 • Satellite data 170° W • Seasonal extrapolations • Controls on So. Ocean blooms • Role of iron • SOFeX- Southern Ocean Iron Experiment • (Jan./Feb. 2002)
Southern Ocean – who cares? • Largest HNLC region in the world • Major site of deep & intermediate water formation • Controls on paleo climate • regulate atmospheric CO2 via biological pump? • Opal “paradox” - does enhanced preservation or flux of bSi lead to high sediment Si in the “opal belt”?
Southern Ocean • PFZ = Polar Frontal Zone (boundary where N-flowing waters sink; strong Δtemp) • POOZ = Permanently Open Ocean Zone • (varies in extent- narrow along 170° W) • SIZ = Seasonal Ice Zone • (area = Antarctic continent; short growth season; melt water effects) US JGOFS
Antarctic Environment and Southern Ocean Process Study (AESOPS) • 4 cruises: Oct. ’97 – Mar. ’98 along 170º W 50-55°S: Central Subantarctic Zone 55-59°S: North of Antarctic Polar Front 59–61.5°S: Antarctic Polar Front 61.5-65.5°S: South of Antarctic Polar Front 65.5-68°S: South of Ant-arctic Circumpolar Current 68-72°S: North of Ross Sea
Deep winter mixed layers • Ice retreat from 62 to >72° S leads to rapid shoaling of MLZ w/spring warming & low salinity melt waters • North of 59° S, deeper mixed layers return earlier • 1%/MLZ <1 = light limits in Oct/Nov and north of 59° S
Primary Production highest in December all latitudes • No Prim Prod work in Jan/Feb • & very low Prim Prod in Feb/Mar • POC flux increases Jan/Feb 60-65° S • and Feb/Mar 65-72° S
Chlorophyll-a highest at all latitudes in Dec. and 63 – 67° S in Jan/Feb • Lowest Chl in Feb/Mar • Fucoxanthin diatom pigments high Dec. 60-65° S and highest 65° S in Jan/Feb
AESOPS- first JGOFS Process study during SeaWiFS • Satellite ocean color ~ chlorophyll • So. Ocean is cloudy (black area) and ice covered (black lower left region) • So. Ocean has low chlorophyll in general • Cruise tracks (white lines) catch only small portion of high chlorophyll regions Fig. from Landry et al.
Satellite data binned by week and 1 degree latitude along 169-171° W • Melt waters along ice edge (gray) show lowest temp & highest Chl. APF • So. Ocean blooms associated with retreating ice edge and not Polar Front
Use satellite color to extend ship’s data in space and time • Compile data along latitude bins • Weekly satellite data shown as line w/variability • Comparison to surface Chl. good • Note high Chl. follows ice retreat
Calculate seasonal PProd (Behrenfeld & Falkowski) • Need Chl, photo period, irradiance, depth of 1%, P^Bopt • Measured and calculated PProd agree • See 2x higher PProd than “traditional” B&F would predict- higher P^Bopt used here • Missed SIZ bloom peaks on ship
Calculate seasonal balance of Production and export from ship’s measurement and extrapolate using satellite based PProd model • Primary Production deceases towards south • New production ~ POC export flux • Particle export/PProd = high, especially in south Despite low PProd, shallow POC flux is relatively high i.e. biological pump is very efficient!
What geochemical changes follow ice edge blooms? Southward progression of Silica front associated with diatom bloom Fig. from Hiscock et al.
Particulate bSi flux associated with diatom export 59-65°S (end of opal “paradox”) Buesseler et al., 2001
What about micro-nutrients? Iron story • Fe decreases from >0.2 to <0.2 nM in region of Polar Front & south (59-65.5° S) • Fe always low north of APF and south of ACC • (<0.2 nM) Data from Measures and Vink, 2001
How does the phytoplankton community change in response to: • Light • Stratification/mixing • Macro/micro nutrients • Grazing • Self shading • Temperature/salinity
Early Spring • Light limited • Low Chl & PProd • Low photo efficiency • Smaller diatoms & phaeo at Polar Front
Spring Bloom at Polar Front • N = small phyto • Large diatoms south of Polar Front • Ice edge spp. in far south
Bloom Moves South • Si & Fe drops • High fucox. @65S • Ice edge spp. >65S
Always low Si Iron <0.2 nM Generally deeper MLZ Smaller phytoplankton High photo efficiency Low particle flux 59 – 65.5° S; PFZ & S-PFZ 65.5 - 72° S; S-ACC & N-RS 50-59° S; N-PFZ & C-SAZ • High Si front moves south • Iron starts >0.2 nM & decreases • Shallow spring MLZ • Centric diatom bloom moves S • High photo efficiency • High POC and highest bSi flux • High Si always • Iron <0.2 nM • Shallow spring MLZ • Ice edge species only • Low photo efficiency • High POC flux
Melting ice, primary production, and particle export in the Southern Ocean- what’s the connection? • Onset of blooms related to stratification (heating N of APF & melting S of APF • Relative levels of Fe & Si determine species composition • Fe stress leads to end of/lack of large diatoms • Grazing plays a larger role in north (small cells/no ice cover) & later in Polar Front region after diatom crash • Polar Front region starts with relatively high Fe (Fe from upwelling & not melting ice) • Southern Ocean has high export for both bSi & POC despite low Chl & primary productivity
The iron story, cont. • Fv/Fm = photo efficiency, increases with higher iron • Higher Fv/Fm and Fe associated w/smaller phytoplankton in north (but higher Fe thought to favor larger phytoplankton?) Sosik & Olson
59-65 S and further north- seasonal increase & maintained high >65 S- always low P^Bopt (and Fv/Fm)? Data from Hiscock et al.
What would happen if Fe stress were relieved? SOFeX – Southern Ocean Iron Experiment Jan/Feb 2002 R/V Revelle – R/V Melville – USCG Polar Star Add Fe & SF6 to two 15x15km patches N- patch (high NO3, low Si) @ 56 05’S 172 W S- patch (high NO3, high Si) @ 66 30’S 172 W
RV Melville- last data from Feb. 14th 3.5 weeks after first addition of iron & SF6 to S-patch Fv/Fm Chl-a pCO2
First Survey from USCG Polar Star SF6 positively identifies this as the SOFeX patch (SF6 & iron added 4 weeks earlier!) L. Houghton & L. Goldson Phytoplankton show positive response to iron addition E. Abraham
SeaWiFS ocean color Satellite image- Feb. 12 SOFeX site F. Chavez et al.
South to North transect through patch center 1.4 ug/l Large Small Patch center South Edge North Edge Bloom within patch- 5-20 um phytoplankton dominate Blooms outside patch- even larger phytoplankton?
Microscopic views of phytoplankton within patch (400x views) - see lots of chain forming diatoms & other large centric and pennate species P.Croot et al.
So what about particle export during SOFeX? • Despite high Chl & diatoms- no difference in vs. out in thorium-234 • Yes, there was export, but not “crash” after 1 mo. • May still be enhanced bSi and POC export if large cells • were sinking?
SOFeX Summary • Logistical success • Elevated Chlorophyll both N & S of Polar Front • pCO2 decreased • Nutrients depleted (NO3 & Si) • Enhanced Fv/Fm • Blooms of pennate diatoms in N-patch • Blooms of centric and large chain diatoms in S-Patch • Did not see crash of S (and N?) bloom- • - maintained high photo efficiency • - low loss terms w/efficient recycling of Fe • Would natural or artificial Fe fertilization ever lead to significant carbon export & sequestration? • - climate links remain uncertain