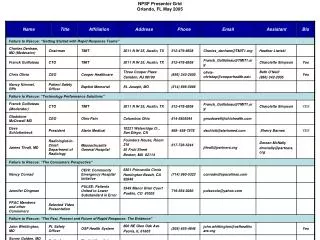
Download
1 / 25
250 likes | 305 Vues
SPP Indicators B-7 and B-8: Overview and Results to Date for the Florida Prekindergarten Program for Children with Disabilities. PreK Coordinators Meeting Orlando, FL - May 6, 2010 Batya Elbaum University of Miami. State Performance Plan.

E N D
SPP Indicators B-7 and B-8: Overview and Results to Date for the Florida Prekindergarten Program for Children with Disabilities PreK Coordinators Meeting Orlando, FL - May 6, 2010 Batya Elbaum University of Miami
State Performance Plan • The current SPP began in FY 2005-06 and will remain in effect through FY 2010 - 2011 • Each year, States must submit an Annual Performance Report to OSEP that reports on state-level progress on each indicator • Each year, LEA performance must be reported publicly
Critical features of the SPP • Valid and reliable data • Report of baseline data • Selection of targets • Improvement or slippage • Improvement activities
SPP/APR Part B Indicator #8 “Percent of parents with a child receiving special education services who report that schools facilitated parent involvement as a means of improving services and results for children with disabilities.”
Preschool parent survey items parents agree with most • People from preschool special education, including teachers and other service providers, are available to speak with me. • People from preschool special education treat me as an equal team member.
Preschool parent survey items parents agree with less • My recommendations are included on the IEP/IFSP. • I am part of the IEP/IFSP decision-making process.
Preschool parent survey items parents agree with a lot less • People from preschool special education explain what options parents have if they disagree with a decision made by the preschool special education program. • People from preschool special education give me options concerning my child’s services and supports.
Parent survey items parents agree with least • People from preschool special education give parents the help they may need, such as transportation, to play an active role in their child’s learning and development. • I have been asked for my opinion about how well preschool special education services are meeting my child’s needs.
How we get the percent on the indicator • We calculate a measure on the scale for each parent. We can display these in a graph that allows us to visualize the results for the group as a whole. • We apply the state-determined minimum standard of a measure of 600. • We count the number of parents with measures at or above 600 and divide by the number of parents who responded to the survey. • The result is the percent on the indicator.
Distribution of measures for parents of preschool children 2008-09
Response rates • Number of 2009 responses and response rates (mailed survey) • K-12: 8.9%; n = 13,369 • PreK: 15.5% n = 3,479 • Number of 2010 responses as of 4/15/10 (online + paper) • K-12: 0-540; 14 districts > 100; n = 4,123 • PreK: 0-67; 8 districts > 20; n = 593
Activities to boost response rates and facilitate parent involvement • Activities at the state level • Activities at the district level • Activities at the school level
SPP/APR Part B Indicator #7 “Percent of preschool children with IEPs who demonstrate improved: • Positive social-emotional skills (including social relationships); • Acquisition and use of knowledge and skills (including early language/ communication and early literacy); and • Use of appropriate behaviors to meet their needs.”
Child Outcomes Reporting Categories • For each outcome area we must report: • A - % of children who did not improve functioning • B - % of children who improved functioning but not sufficient to move nearer to functioning comparable to same-aged peers • C - % of children who improved functioning to a level nearer to same-aged peers but did not reach it • D - % of children who improved functioning to reach a level comparable to same-aged peers • E - % of children who maintained functioning at a level comparable to same-aged peers
Florida’s use of BDI-2 assessment data • Developmental status measured at program entry and program exit • A standard score of 78 or above (>-1.5 SD) is considered to represent a level of functioning that is “comparable to same-aged peers”
Florida’s use of BDI-2 assessment data Indicator 7-A: Personal-Social domain Indicator 7-B: Communication domain Indicator 7-C: Adaptive domain
Summary statement #1 • Of those preschool children who entered the preschool program below age expectations in each Outcome, the percent who substantially increased their rate of growth by the time they turned 6 years of age or exited the program. (c+d/a+b+c+d) for each outcome category) • Outcome A: 66.2% • Outcome B: 59.2% • Outcome C: 59.9%
Summary statement #2 • The percent of preschool children who were functioning within age expectation in each Outcome by the time they turned 6 years of age or exited the program. (d+e/a+b+c+d+e) for each outcome category) • Outcome A: 75.8% • Outcome B: 52.8% • Outcome C: 73.6%
Child Outcomes Reporting Requirements • Baseline data reported in February 2010 (reflecting assessments of children who exited in 2008-09) • State and school district outcomes will be publicly reported beginning in 2011, when we will report progress towards targets
Factors that may affect reported percentages on this indicator • Factors related to data collection • Completeness of assessment data • Reliability of assessment data • Accurate basals and cielings • Proper administration of items • Accurate scoring of items • Accurate scoring of assessment domains • Accurate data entry into Data Manager
Factors that may affect reported percentages on this indicator • Factors related to children and services • Child’s time in program • Type and severity of delay(s) on entry • Type and intensity of services provided
State efforts to ensure high-quality data while maximizing efficiency of the Child Outcomes Measurement System • BDI-2 trainings by Riverside staff • BDI-2 Training-of-trainers • Guidelines for use of BDI-2 Screening Test • Permissible entry of raw scores (vs. item-level data) into Data Manager, with Quality Assurance check • Ongoing conversations with Riverside to improve the Data Manager • NECTAC/ECO-sponsored BDI-2 workgroup