Download
1 / 12
120 likes | 253 Vues
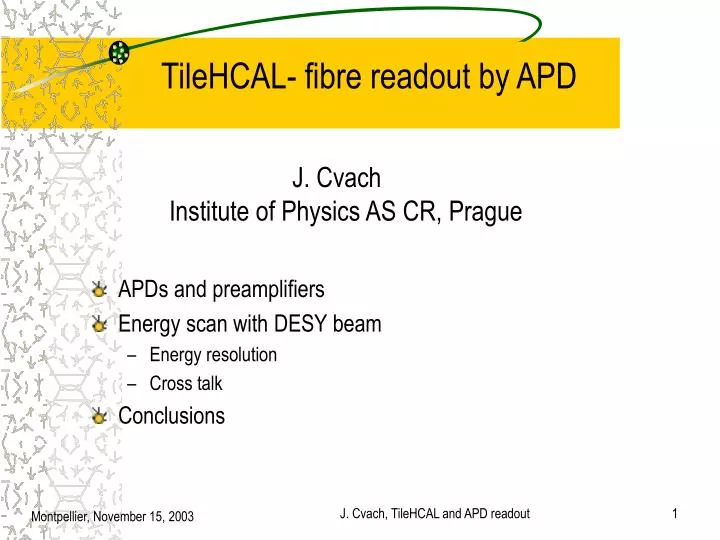
T ileHCAL- fibre r eadout by APD. APDs and preamplifiers Energy scan with DESY beam Energy resolution Cross talk Conclusions. J. Cvach Institute of Physics AS CR, Prague. APD S8550. signal dependence on U bias , T. APD gain stable at 1% level: Δ U/ Δ T ≃ -0.65 V/ºC (G ~ 200).

E N D
TileHCAL- fibre readout by APD • APDs and preamplifiers • Energy scan with DESY beam • Energy resolution • Cross talk • Conclusions J. Cvach Institute of Physics AS CR, Prague J. Cvach, TileHCAL and APD readout
APD S8550 signal dependence on Ubias, T APD gain stable at 1% level: ΔU/ΔT ≃ -0.65 V/ºC (G ~ 200) Short reminder • Measurements of characteristics of 32ch. matrix S8550 and single channel 3x3 mm2 S8664-55APDssummarized in Amsterdam by S. Němeček • Gain and excess noise factor calculated • Gain dependence 1/G*dG/dT = ~12% • Gain dependence 1/G*dG/dU = ~15% at max G • PS with ΔU/U = 10-4 1% gain stability • Single channel APDs S8664-55 (3x3 mm2) better in all characteristics than 32ch. matrix S8550 • New preamp chips (25 pieces) were delivered (beginning of July) based on LAL Orsay design for ECAL – we made PCB + masks • 2 types of preamps: • Prague: voltage preamp – discrete components -16ch • LAL: charge preamp – chip –18 channels
Prague preamp, mask with 45 fibres (15 ch.), beam enters from the right to the tile row T=26°C T=27°C APD tests at DESY e beam • Calibration run – tiles not in the absorber (each APD connected to 3 tiles = 1 cell) • same Ubias for all APDs different gain of APDs (optical contact between fibres and APDs) leads to the spread of the signal • Ebeam = 3 GeV, Ubias = 400 - 440 V • Calibration constants used for all Ebeam J. Cvach, TileHCAL and APD readout
signal -pedestal signal/noise working point at 420 V APD gain vs. Ubias • We decided to use Ubias = 420 V for the Prague preamp. • S/N ~ 4-5 reasonably large for mip at 420 V. • We can work at lower Ubias (more stable APD regime). Preamp gain can be increased. • But in the shower signal must be attenuated! We are limited by ADC range. J. Cvach, TileHCAL and APD readout
Facing minical from beam side cell 3 cell 2 absorber plate cell 1 beam tile 5x5 cm2 Beam window 5.5 cm E measurements in minical – LAL preamp • Beam positioned in the tile centre with accuracy better than ± 1 cm • Ebeam = 1 – 6 GeV in 1 GeV steps, T = 25°C, Ubias = 415 V J. Cvach, TileHCAL and APD readout
Ebeam = 2 GeV beam Ebeam = 5 GeV Cell 3 Cell 2 Cell 1 Shower development with APDs • ADC counts for cells 1-4 at Ebeam = 1–6 GeV, signal in cells 1-3 reduced by 10 dB • Cell 4 contributes to signal by ≥ 4% for Ebeam ≥ 4GeV ADC Counts J. Cvach, TileHCAL and APD readout
4 GeV 1 GeV 5 GeV 2 GeV 3 GeV 6 GeV ADC counts Energy sums for APD readout • Cells 1-4 calibrated by the cell signal taken with 3 GeV w/o absorber plates: corrections ≤ 10% • Contribution from cell 4 at Ebeam≤ 3 GeV is negative (~ 1%) –> cross talk • LED calibration was tested but was not available for cells 1-4 • Signal fitted by Gaussian and used for energy resolution J. Cvach, TileHCAL and APD readout
Energy resolution with APDs • Good linearity, small systematic deviation in the slope (beam not in the tile centre?) • No estimate of systematic error yet • Energy resolution comparison (see Erika): Fit values for PM APD MC P1 0.1 ± 0.2 0.5 0.4 ± 0.2 P2(%) 21.0 ± 0.4 24.4 17.1± 0.1 SiPM values similar to PM values • reasons for worse resolution: • noise of APD • lower tile light yield (estimate: 17 ph.e./tile) • tile alignment ( alignment with beam) • calibration J. Cvach, TileHCAL and APD readout
E = 1 GeV signal pedestal Cross talk at Ubias = 415 V E = 3 GeV E = 6 GeV Channel 4 - ADC counts Cross talk between channels - LAL preamp • In the energy scan cells 1-4 connected to preamp channels 3->0 • Remaining channels show negative cross talk -1 % • xtalk(ch k) = J. Cvach, TileHCAL and APD readout
Cross talk between channels - Prague preamp Ubias = 420 V • Calibration measurements with APD S8664-55 (3x3 mm2) • light collected from 3 tiles in 3 GeV e- beam (~mip) • All preamp channels but one (channel 0) connected to APDs cross talk • Ubias = 400 – 430 V • Cross talk = • cross talk < 1% for all Ubias • Cross talk between preamp channels ≲ 1% (true for Prague and LAL preamps) Channel 0 S-ped=0.2 Signal, ch.1 S-ped=65-15 ADC counts J. Cvach, TileHCAL and APD readout
Pixels with light LED A on pixel switched on, other off LED A+C LED A+D LED A+C+D on Cross talk between pixels – S8550 (Prague preamp) Pixel without light Cross talk < 1.5 % < 1 % J. Cvach, TileHCAL and APD readout
Conclusions • We have 4 preamp types for APDs – they were not optimized for conditions of the calorimeter • The sophisticated LED calibration system was tuned with PMs go for tests with APDs in minical! • We have PS with ΔU/U = 10-4 . APDs will be sorted into groups with the same gain and connected to the same Ubias • Temperature must be recorded during measurements (we prepare in Prague a temperature stabilized chamber and will measure the APD gain dependence on temperature) – will be LED calibration sufficient? • First measurement of energy resolution with APDs in minical show good linearity but worse resolution in comparison with PM and SiPM. Forthcoming beam tests will improve it! J. Cvach, TileHCAL and APD readout