Download
1 / 16
160 likes | 305 Vues
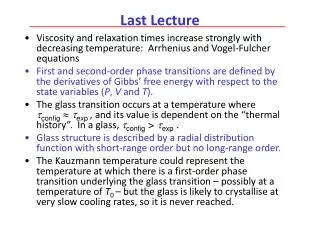
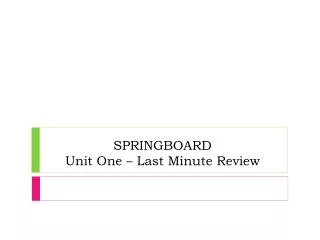
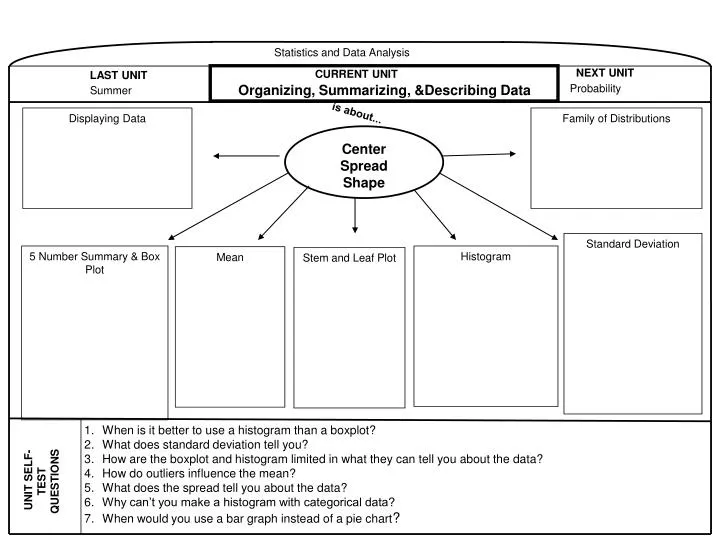
Statistics and Data Analysis. NEXT UNIT. CURRENT UNIT. LAST UNIT. CURRENT UNIT. Organizing, Summarizing, &Describing Data. Probability. S ummer. is about. Displaying Data. Family of Distributions. Center Spread Shape. Slope Triangles. Standard Deviation. 5 Number Summary & Box Plot.

E N D
Statistics and Data Analysis NEXT UNIT CURRENT UNIT LAST UNIT CURRENT UNIT Organizing, Summarizing, &Describing Data Probability Summer is about... Displaying Data Family of Distributions Center Spread Shape Slope Triangles Standard Deviation 5 Number Summary & Box Plot Histogram Mean Stem and Leaf Plot When is it better to use a histogram than a boxplot? What does standard deviation tell you? How are the boxplot and histogram limited in what they can tell you about the data? How do outliers influence the mean? What does the spread tell you about the data? Why can’t you make a histogram with categorical data? When would you use a bar graph instead of a pie chart? UNIT SELF-TEST QUESTIONS
Bill Gates makes $500 million a year. He’s in a room with 9 teachers, 4 of whom make $40k, 3 make $45k, and 2 make $55k a year. What is the mean salary of everyone in the room? What would be the mean salary if Gates wasn’t included? Mean With Gates: $50,040,500 Mean Without Gates: $45,000
How do we determine if a number is an outlier ? To find any outliers in a set of data, we need to find the 5 Number Summary of the data.
5 number summary and boxplotsA five number summary is a statistical tool used to quickly summarize and gain insight about a set of data.
Constructing a box and whisker plot • Step 1 - Find the median: the middle value in a data set when you put the numbers in order. 18, 40, 50, 58, 59, 59, 61, 68, 69, 70, 70, 71, 80, 93, 100 68 is the median of this data set.
Step 2 • Find the lower quartile. • The lower quartile is the middle of the data set to the left of median. (18, 40, 50, 58, 59, 59, 61), 68, 69, 70, 70, 71, 80, 93, 100 58 is the lower quartile
Step 3 • Find the upper quartile. • The upper quartile is the middle of the data set to the right of the median. 18, 40, 50, 58, 59, 59, 61, 68, (69, 70, 70, 71, 80, 93, 100) 71 is the upper quartile
Step 4 • Find the maximum and minimum values in the set. • The maximum is the greatest value in the data set. • The minimum is the least value in the data set. 18, 40, 50, 58, 59, 59, 61, 68, 69, 70, 70, 71, 80, 93, 100 18 is the minimum and 100 is the maximum.
Step 5 Find the Interquartile Range (IQR) 18, 40, 50, 58, 59, 59, 61, 68, 69, 70, 70, 71, 80, 93, 100 = 19.5
Step 6 • Mark the upper and lower fence • lower fence (LF):Q1 – 1.5×IQR • Upper fence (UF): Q3 + 1.5×IQR If LF and UF is within data set mark boundaries and Dot in outliers (otherwise keep max min marks) 18, 40, 50, 58, 59, 59, 61, 68, 69, 70, 70, 71, 80, 93, 100 30.5 90.5
Example The weights of 20 randomly selected juniors are recorded below: a) Construct a boxplot of the data b) Determine if there are any mild or extreme outliers.
Example - Answer Q1 = 130.5 median = 138 Q3 = 145.5 Min = 121 Max = 213 IQR = 15 UF = 168 LF = 108 * * 100 110 120 130 140 150 160 170 180 190 200 210 220 230 240 250 260 Weight
Distribution Shape Based on Boxplots: • If the median is at the center of the box and each horizontal line the data is symmetric (mean is equal to the median) • median is to the left of the center then data is skewed right (mean is right of median) • median is to the right of the center then data is skewed left (mean is left of median)