Download
1 / 52
520 likes | 607 Vues
SQL Server 2012 for Business Intelligence. UTS Short Course. Mehmet Ozdemir – SA @ SSW. w: blog.ozdemir.id.au | e: mehmet @ssw.com.au | t: @ mozdemir_au. SQL Server, BI, Infrastructure Specializes in Application architecture and design SQL Performance Tuning and Optimization

E N D
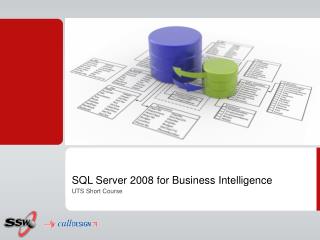
SQL Server 2012 for Business Intelligence UTS Short Course
Mehmet Ozdemir – SA @ SSW w: blog.ozdemir.id.au | e: mehmet@ssw.com.au | t: @mozdemir_au • SQL Server, BI, Infrastructure • Specializes in • Application architecture and design • SQL Performance Tuning and Optimization • HyperV, SCVMM • Technology aficionado • Virtualization • Reporting/BI • Cubes
Admin Stuff • Attendance • You initial sheet • Hands On Lab • You get me to initial sheet • Homework • Certificate • At end of 5 sessions • If I say if you have completed successfully
Course Website • http://sharepoint.ssw.com.au/Training/UTSSQL/Pages/default.aspx • Course Timetable • Course Materials
Last week(s) • Cubes • What is a cube? • Measures/Facts? • Dimensions? • Hierarchies? • Time Dimensions? • Cube Browser? • Why?
Homework • Where does the cube live? • Why do we need to provide "Impersonation Information" in our Data Source? • What is a dimension hierarchy?
Session 3: Tonight’s Agenda • What is SQL Reporting Services? • Steps in Creating a Report • Demo: Creating a Report • Hands on Lab
Business Intelligence Defined Business intelligence (BI) is a broad category of applications and technologies for gathering, storing, analyzing, and providing access to data to help enterprise users make better business decisions.
Step by step to BI • Create Data Warehouse • Copy data to data warehouse • Create OLAP Cubes • Create Reports • Do some Data Mining • Discovering a Relationship that was not obvious • Predict future events (e.g. targeting and forecasting)
What is SQL Server Reporting? • Reporting platform • Traditional • Interactive reports • Scalable and manageable server infrastructure • Integrated with • SharePoint • Office applications • Browser and other familiar tools • Single platform and tools for all types of structured data • Relational • Hierarchical • Multidimensional
SQL Server BI Platform Reporting Services Development Tools Management Tools Analysis Services OLAP & Data Mining Integration Services ETL SQL Server Relational Engine
Authoring Management Delivery Reporting Lifecycle • Reporting Services is an open and extensible platform supporting the authoring, management and delivery of rich, interactive reports to the entire enterprise.
Report Authoring • Reports are defined in Report Definition Language (RDL), a documented XML schema • Use Microsoft or 3rd party tools that support RDL • Create single reports from multiple data sources(SQL, OLE DB, ODBC, Oracle, and .NET data providers) More info on the RDL spec: http://bit.ly/11lcd3n
Report Authoring - Controls • Data regions • Tablix • Table • List (like Access) • Matrix • Chart • Gauge • Databar • Subreports • Images • Custom Controls • 3rd Party Controls
Tablix • Generalized layout report item • Grouped and Detail data
Tablix - Table • Use a table to display detail data • Organize the data in row groups, or both. • The Table template contains three columns with a table header row and a details row for data.
Tablix - Matrix • Use a matrix to display aggregated data summaries • Grouped in rows and columns, similar to a PivotTable or crosstab. • The number of rows and columns for groups is determined by the number of unique values for each row and column groups
Tablix - List • Use a list to create a free-form layout. You are not limited to a grid layout, but can place fields freely inside the list. • You can use a list to design a form for displaying many dataset fields or as a container to display multiple data regions side by side for grouped data.
Drill-through Reports • Start in Report Builder • Get the data you want • In report properties choose Allow users to drill to this report option • Optionally customize in Report Designer
Interactivity • Document maps • Collapse / Expand • Actions
Report Management • Report definitions, folders, and resources are published and managed in a reporting web service • Managed reports can be executed either on-demand or via schedule and can be cached for consistency and performance • Scalable & Extensible server architecture
Report Delivery • Traditional (paper) and interactive (web) reports • On-demand (“pull”) or event-based (“push”) delivery • Many formats (HTML, Excel, PDF, XML, Word, Zip File*) • Deliver reports to many devices (e-mail, file share, etc.) • Ad-hoc Reporting
SSRS and SSAS – Working Together Standard reports Ad hoc reports Detail reports SSAS SSRS • Intuitive reporting • Interactive analysis • High performance • Powerful calculations • Detail reporting • Standard reporting • Ad hoc reporting • Flexible delivery
SSAS and Reporting Services Data Layer SSAS Presentation Layer UnifiedDimensionalModel ETL DB1 Interactive reporting UDM DB2 DW Standard reporting DB3 multiple data sources supported Ad hoc reporting • Dimensional schema = intuitive reporting • SSAS for better performance and business metrics • UDM serves many reporting needs
Client side • Reportviewer Control in "local mode" • ASP.NET • Windows Forms • Silverlight • WPF • What about MVC? • http://stackoverflow.com/questions/15208437/how-can-i-use-a-reportviewer-control-with-razor
Resources • http://www.ssw.com.au/ssw/standards/Rules/RulesToBetterSQLReportingServices.aspx All about the ReportViewer control • http://www.gotreportviewer.com/
Usergroups SQL Server UG • http://www.ssw.com.au/ssw/netug/ • http://www.sqlserver.org.au/
Summary • What is Reporting Services? • Steps in Creating a Report • Demo: Creating a Report • Hands on Lab