Download
1 / 17

E N D
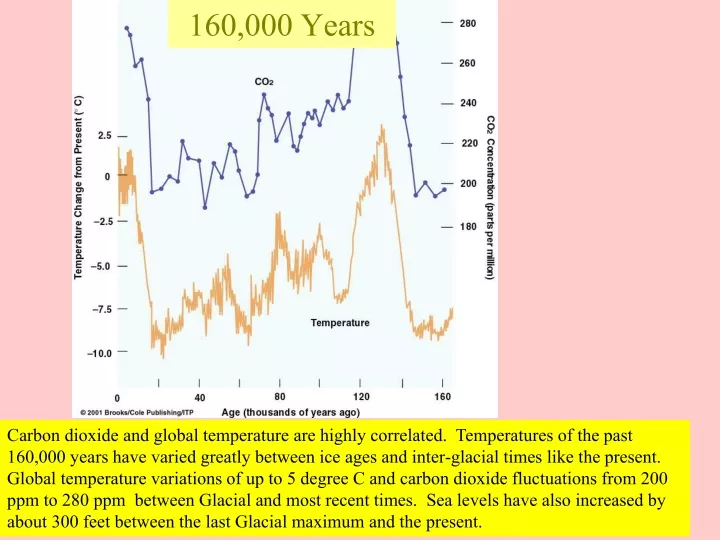
160,000 Years Carbon dioxide and global temperature are highly correlated. Temperatures of the past 160,000 years have varied greatly between ice ages and inter-glacial times like the present. Global temperature variations of up to 5 degree C and carbon dioxide fluctuations from 200 ppm to 280 ppm between Glacial and most recent times. Sea levels have also increased by about 300 feet between the last Glacial maximum and the present.
Medieval Climate anomaly (warm period) was warm but not as warm as present (post 1980). It is also uncertain how uniform the warming was. Some have suggested variations in solar brightness caused this warming.
Solar activity stored in radio carbon 14C http://en.wikipedia.org/wiki/Little_Ice_Age#Volcanic_activity
1000 years Some have argued that low solar activity was linked to the little Ice ace between 1400 and 1800 (the Maundar Minimum) recent evidence suggests that a series of volcanic eruptions could be responsible for the little ice age. Another possibility is a slowing of the North Atlantic Thermal haline conveyor. Others believe that the little ice age was confined to western Europe and so was a result of more localized climate influences. In any event alpine glaciers in Europe grew during this time (1400-1800)
Climate of the last 1000 yr Paleoclimate reconstruction suggest a much smaller little ice age signal. Climate change of the past 100 years is larger than anything inferred from paleoclimate proxy data over the past 1000 years. Gray line indicate uncertainty of estimates. More recent measurement have less uncertainty than measurement inferred from long ago. (graph from IPCC 2007)
NASA Global Mean Surface Temperature Observations suggest that global mean surface temperatures have increased by about 0.7 degree C (1.3 F) over the past century.
Trends in Temperature Observations suggest: 1) Most warming at High NH latitudes. 2) More warming over land than oceans. This is in agreement with model predictions for expected warming from greenhouse gases.
Warming in the troposphere/surface and Stratospheric Cooling
Global warming Stalled?? http://data.giss.nasa.gov/gistemp/
Global warming Stalled?? Near zero or negative trends are rare since 1970 so this stalling of surface temperature increases is real and requires understanding.
http://sealevel.colorado.edu/ Sea level continues to rise
Total Ocean Heat content continues to rise. Global warming has not disappeared.
Regional vs Global Climate variability Vancouver WA temperature data: Little of the signal is a linear trend most is year to year variability. Since the expected greenhouse signal is more like the linear trend There is little indication of global warming in local data. This also suggests that regional effects of global warming are much harder to predict.
Regional vs Global Climate variability Most of the global mean record is described by the 5 yr running mean. There is little year to year variability in the signal and a strong greenhouse gas component (linear trend). The internal exchange of energy between different regions doesn’t influence Global mean Temperatures much. We have confidence that a greenhouse gas signal is present in the global mean temperature data.