Download
1 / 7
70 likes | 260 Vues
South America – population distribution. In this lesson we will consider the population density of different countries in South America. To calculate population density: Population Area. Let’s see is we can calculate the population density in Hong Kong

E N D
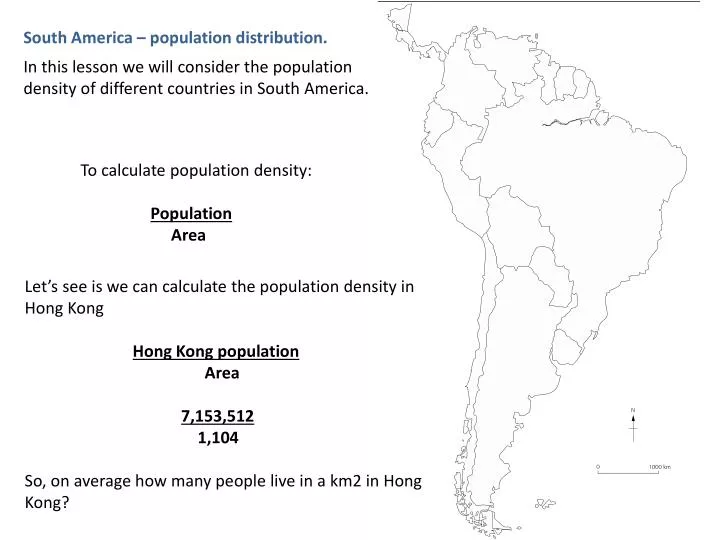
South America – population distribution. In this lesson we will consider the population density of different countries in South America. To calculate population density: Population Area Let’s see is we can calculate the population density in Hong Kong Hong Kong population Area 7,153,512 1,104 So, on average how many people live in a km2 in Hong Kong?
On your teachers wiki/weebly is an Excel spreadsheet with this table, you are going to use it to calculate the population density of all the countries in South America
Now go to your teachers weebly/wiki and play the short film on how to use excel to calculate population density.
If your table now looks like the one above then you have cracked it! Well done!
Now it’s time to use your data to make a choropleth map. Put an example of a choropleth map here
There are some rules when drawing a choropleth map: • You must select colours from the same family of colours • Your colours must go from dark to light • For your choropleth map the countries that are most densely populated should be the darkest, the countries that are least densely populated should be the lightest.
Now go to your teachers wiki/weebly and watch the video on how to use the internet to produce a choropleth map