Download
1 / 15
150 likes | 253 Vues
Quantitative Literacy in Political Science? Howard Gold Department of Government Smith College. Do you think that all students should be required to take one quantitative course at Smith College?. Source: GOV 312 Survey of Smith College students, April 6-16, 2006.

E N D
Quantitative Literacy in Political Science? Howard Gold Department of Government Smith College
Do you think that all students should be required to take one quantitative course at Smith College? Source: GOV 312 Survey of Smith College students, April 6-16, 2006.
Do you think that all students should be required to take one quantitative course at Smith College? Source: GOV 312 Survey of Smith College students, April 6-16, 2006.
Do you think that all students should be required to take one quantitative course at Smith College? Source: GOV 312 Survey of Smith College students, April 6-16, 2006.
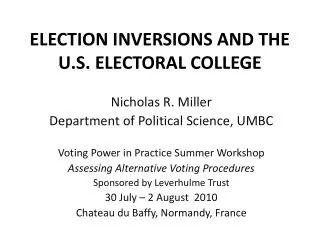
Electoral Vote = 4.5 (Popular Vote) – 1.8 R2 = .93. Standard error of the prediction = .077. If John Kerry wins .501 of two-party popular vote, this model predicts he will win .45 of the two-party electoral vote.
Predictions in 2004: Percent of Two-Party Popular Vote Bush will Receive
Lewis-Beck and Tien “Jobs” Model: Forecast for 2004 Dependent variable: Percent of two-party vote received by candidate of incumbent party. • Coding of Variables: • Presidential Popularity is Gallup approval rating of the President measured in the first July poll before the election. • GNP x Elect is the growth rate in real GNP during the first 6 months of the election-year multiplied by whether an incumbent President is running (coded 1) or not running (coded 0.5). • Incumbent Party Advantage is coded as follows: 1 if incumbent candidate is the elected president (1956, 1972, 1980, 1984, 1992, 1996) or following a president who died in office (1948, 1964); 0 if incumbent party candidate has a tolerable association with the previous president (1952, 1976, 1988); and -1 if incumbent party candidate and the president are not united (1960, 1968, 2000). • Jobs is growth in jobs over first 3.5 years of president’s term. Calculated as follows: • (# employed in June of election year - # employed during January of inauguration year) • # employed during Januaryof inauguration year • and multiply that by 100.
GOV 312 Survey of Smith College Students, April 6-16, 2006 Version 1 Much of the Smith College apparel sold in our bookstore is manufactured by companies that employ sweat-shop labor. Would you support an effort to limit the amount of apparel that these companies sell on campus? (N=786) Yes 74.8% No 10.6% DK/no opinion 14.6% Version 2 Much of the Smith College apparel sold in our bookstore is manufactured by companies that employ low-income workers in developing countries. Would you support an effort to limit the amount of apparel that these companies sell on campus? (N=683) Yes 62.4% No 16.0% DK/no opinion 21.7%
GOV 312 Survey of Smith College Students, April 6-16, 2006 Version 1 Evo Morales, leader of the Socialist Party, was recently elected President of Bolivia. Do you think that his presidency will be good or bad for relations between Bolivia and the United States? (N=784) Good for relations 2.8% Bad for relations 30.7% DK or no opinion 66.5% Version 2 Evo Morales, leader of the MAS party, was recently elected President of Bolivia. Do you think that his presidency will be good or bad for relations between Bolivia and the United States? (N=681) Good for relations 2.9% Bad for relations 12.9% DK or no opinion 84.1%
GOV 312 Survey of Smith College Students, April 6-16, 2006 Version 1 How likely are you to vote for the presidential nominee of the Republican Party in 2008? Extremely likely 6.9% Somewhat likely 9.1% Somewhat unlikely 16.1% Extremely unlikely 62.5% I will not vote or I cannot vote 5.4% Version 2 How likely are you to vote for the presidential nominee of George W. Bush’s party in 2008? (N=683) Extremely likely 2.9% Somewhat likely 4.7% Somewhat unlikely 10.2% Extremely unlikely 73.6% I will not vote or I cannot vote 8.5%
“Gender and Politics”: Incorporating a Quantitative Module This module assumes no prior experience with statistics or data analysis. In the course of 2 lectures, students are provided with an introduction to analyzing survey data. The lectures cover: Independent, dependent and control variables Reading a codebook Creating new variables from existing ones 2-way contingency tables 3-way contingency tables Interpreting the chi-square test of independence Computing and interpreting a 95% confidence interval around the difference between 2 sample proportions.
The Gender Gap in Voting(American National Election Study, 2004) Pearson Chi-Square p-value = .084.
The Gender Gap in Voting(American National Election Study, 2004) Married: Pearson Chi-Square p-value = .448. Single: Pearson Chi-Square p-value = .043.