Download
1 / 1

E N D
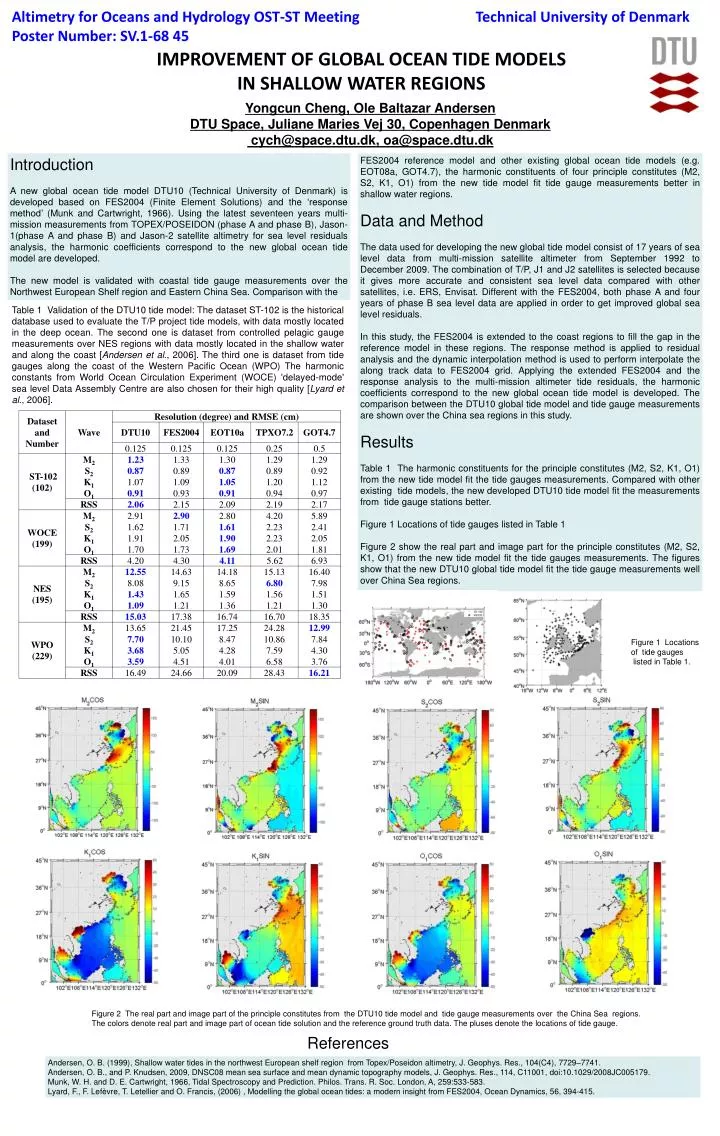
Introduction A new global ocean tide model DTU10 (Technical University of Denmark) is developed based on FES2004 (Finite Element Solutions) and the ‘response method’ (Munk and Cartwright, 1966). Using the latest seventeen years multi-mission measurements from TOPEX/POSEIDON (phase A and phase B), Jason-1(phase A and phase B) and Jason-2 satellite altimetry for sea level residuals analysis, the harmonic coefficients correspond to the new global ocean tide model are developed. The new model is validated with coastal tide gauge measurements over the Northwest European Shelf region and Eastern China Sea. Comparison with the FES2004 reference model and other existing global ocean tide models (e.g. EOT08a, GOT4.7), the harmonic constituents of four principle constitutes (M2, S2, K1, O1) from the new tide model fit tide gauge measurements better in shallow water regions. Data and Method The data used for developing the new global tide model consist of 17 years of sea level data from multi-mission satellite altimeter from September 1992 to December 2009. The combination of T/P, J1 and J2 satellites is selected because it gives more accurate and consistent sea level data compared with other satellites, i.e. ERS, Envisat. Different with the FES2004, both phase A and four years of phase B sea level data are applied in order to get improved global sea level residuals. In this study, the FES2004 is extended to the coast regions to fill the gap in the reference model in these regions. The response method is applied to residual analysis and the dynamic interpolation method is used to perform interpolate the along track data to FES2004 grid. Applying the extended FES2004 and the response analysis to the multi-mission altimeter tide residuals, the harmonic coefficients correspond to the new global ocean tide model is developed. The comparison between the DTU10 global tide model and tide gauge measurements are shown over the China sea regions in this study. Results Table 1 The harmonic constituents for the principle constitutes (M2, S2, K1, O1) from the new tide model fit the tide gauges measurements. Compared with other existing tide models, the new developed DTU10 tide model fit the measurements from tide gauge stations better. Figure 1 Locations of tide gauges listed in Table 1 Figure 2 show the real part and image part for the principle constitutes (M2, S2, K1, O1) from the new tide model fit the tide gauges measurements. The figures show that the new DTU10 global tide model fit the tide gauge measurements well over China Sea regions. Table 1 Validation of the DTU10 tide model: The dataset ST-102 is the historical database used to evaluate the T/P project tide models, with data mostly located in the deep ocean. The second one is dataset from controlled pelagic gauge measurements over NES regions with data mostly located in the shallow water and along the coast [Andersen et al., 2006]. The third one is dataset from tide gauges along the coast of the Western Pacific Ocean (WPO) The harmonic constants from World Ocean Circulation Experiment (WOCE) 'delayed-mode' sea level Data Assembly Centre are also chosen for their high quality [Lyard et al., 2006]. Figure 1 Locations of tide gauges listed in Table 1. Figure 2 The real part and image part of the principle constitutes from the DTU10 tide model and tide gauge measurements over the China Sea regions. The colors denote real part and image part of ocean tide solution and the reference ground truth data. The pluses denote the locations of tide gauge. References Andersen, O. B. (1999), Shallow water tides in the northwest European shelf region from Topex/Poseidon altimetry, J. Geophys. Res., 104(C4), 7729–7741. Andersen, O. B., and P. Knudsen, 2009, DNSC08 mean sea surface and mean dynamic topography models, J. Geophys. Res., 114, C11001, doi:10.1029/2008JC005179. Munk, W. H. and D. E. Cartwright, 1966, Tidal Spectroscopy and Prediction. Philos. Trans. R. Soc. London, A, 259:533-583. Lyard, F., F. Lefèvre, T. Letellier and O. Francis, (2006) , Modelling the global ocean tides: a modern insight from FES2004, Ocean Dynamics, 56, 394-415.