Download
1 / 12
120 likes | 210 Vues
Small Area (e.g. County-level) Estimates. Concepts. Considerable interest in small area estimates of uninsured (e.g. County level) Two estimation methods for an area: Direct : measure rate from a sample of population of interest

E N D
Concepts • Considerable interest in small area estimates of uninsured (e.g. County level) • Two estimation methods for an area: • Direct: measure rate from a sample of population of interest • Indirect: measure rate from a “superpopulation” and apply to smaller areas • Direct is preferred, but expensive – necessary to have suitable number of respondents in each area (e.g., 100 counties).
Concepts • Direct estimates, using CPS precision standards, would require surveying approximately 400,000 North Carolinians (4000 per county). • Indirect approach: • Model probability of uninsured for state residents • Apply probability to county residents
? ? ? Indirect Estimation We know that in similar rectangles, 75% of circles and 50% of triangles are blue. 2.25 circles and 2 triangles are blue: (2.25 + 2 ) / 7 = 61% ? ? ? ? ? ? ? ? ? ? Comparison of Direct and Indirect Direct Estimation Four out of six shapes (with known colors) are blue 4/6 = 83%
Methods 1. Use Current Population Survey data on North Carolina residents to estimate the probability of being uninsured in 2002. Allow the following to affect the probability of being uninsured: Age, gender, race/ethnicity, employment status, industry, income, education. 2. Apply observed probabilities to demographics of each county.
Methods • Comparability with other estimates • In most results presented here, we combine last three years putting more weight on recent surveys. • “One year” estimates less precise • “Multiyear” estimates less responsive to trends • Eliminate all respondents age 65 or over. • BRFSS, published by State Center for Health Statistics, has direct estimates on some counties. Different question wording precludes direct comparison. We are working on combining the two approaches to get better estimates. • Direct estimation, of course, still entails surveying a sample
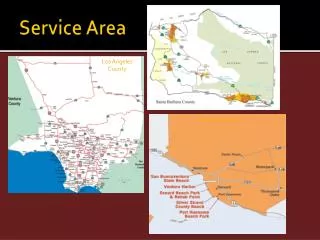
Results • Complete report • Available at • www.shepscenter.unc.edu • Highlights: • Percentage 0-64 year olds without insurance varies from 15.9% (Wake) to 26.1% (Duplin) • Number of uninsured residents varies from 850 (Tyrrell) to 115,000 (Mecklenburg)
CPS (indirect) BRFSS (direct)
Summary • Approximately 18-19 percent of North Carolinians between the ages of 0 and 64 had no health insurance for the entirety of 2003. • Evidence of an increase over the past four years • Considering the risk of being uninsured for a given characteristic may yield different policy conclusions than considering the characteristics of the uninsured • For example, unemployed are more likely to be uninsured, but relatively few uninsured are unemployed. • Increases in statewide uninsured rate due somewhat to changes in demographic structure, but more due to changes in UI rates within demographic • Statewide, evidence of higher uninsured rates in Eastern and Mountain Counties
For More Information • Sheps Center for Health Services Research, UNC • http://www.shepscenter.unc.edu • Click <What’s New> for county-level estimates • 2003 estimates not posted yet, but soon • Kaiser Family Foundation • Analysis of national trends • http://www.kff.org • U.S. Census Bureau • Results of national surveys • http://www.census.gov/hhes/www/hlthins.html • Behavioral Risk Factor Surveillance System • North Carolina State Center for Health Statistics • http://www.schs.state.nc.us/SCHS/brfss/