Download
1 / 29
300 likes | 373 Vues
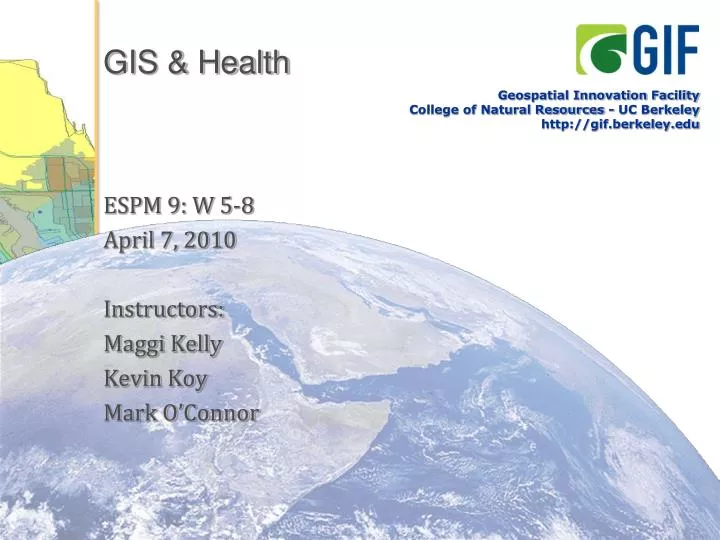
GIS & Health. Geospatial Innovation Facility College of Natural Resources - UC Berkeley http://gif.berkeley.edu. ESPM 9: W 5-8 April 7, 2010 Instructors: Maggi Kelly Kevin Koy Mark O’Connor. Today’s Schedule. Lecture GIS Introduction GIS Functions you will use today Lab 1

E N D
GIS & Health Geospatial Innovation Facility College of Natural Resources - UC Berkeley http://gif.berkeley.edu ESPM 9: W 5-8 April 7, 2010 Instructors: Maggi Kelly Kevin Koy Mark O’Connor
Today’s Schedule • Lecture • GIS Introduction • GIS Functions you will use today • Lab 1 • Getting to know GIS
Geographic Information Systems • GIS Definitions • A GIS is a system for the: entry and editing, storage, query and retrieval, transformation, analysis, and display (soft copy) and printing (hard copy) of spatial data • Digital spatial data from many sources • Key point: All data in a GIS is georeferenced • located by means of geographical coordinates with respect to some reference system • This is how a GIS differs from computer-aided drafting or graphics program
Data Vector Raster/Grid Spatial Data Formats
GIS: Linking Spatial Data with Attribute Data Data Attributes Analysis Process / Interpretation Fast food location, organic food stand location… Sample points, Disease cluster… Measurement of point pattern Points, nodes Distance from roads, length of flow path Animal behavior, water quality… Walking path to work… Lines, arcs Patch size, Patch shape Hospital service zone… Areas of protection or invasion… Polygons, objects Pattern, connectivity Access to fresh food… Animal movement, invasive species dispersal… Raster, pixels, grid cells
GIS Software you will use • ESRI’s ArcGIS is the software that you will use for the labs.
Arc Map View and edit data Analyze data (Geoprocessing) Create maps
Arc Catalog Graphical previews View data (like Windows Explorer) Tables Metadata
Arc Toolbox Map Projections Tools for commonly used tasks
Functions that you will use • There are a number of functions that you will use in the lab today: • Navigation tools • Query / Select by attribute • Buffer • Clip • Merge & Dissolve • Making a Map • Symbology/Display
Geospatial Query:POINTS near LINES Select by location: Toxic release sites within 1 mile of a river Image credit: K. Kurland, 2006
Geospatial Query:POINTS near POINTS Select by location: Schools within ½ mile of polluting companies Image credit: K. Kurland, 2006
Geospatial Query:POLYGONS intersecting LINES Select by location: Municipalities that intersect Interstates Image credit: K. Kurland, 2006
Geospatial Query:LINES intersecting POLYGONS Select by location: Linesintersectingpolygons Image credit: K. Kurland, 2006
Function: Dissolve/Merge • When you want to dissolve boundaries between similar objects, you can use the Dissolve function. • To join features from multiple inputs into a single output use Merge.
Function: Buffer • When you want to look at the distance away from an object, you can create spatial buffers.
Function: Intersect & Union • When you need to combine different layers or features, you can use: • Intersect: to find what is common to both inputs; • Union: to find what is in both inputs.
Function: Clip • When you need to clip, or cookie-cut one layer with another layer, you can use Clip. • You can also do the opposite, with Erase.
Power of Maps • Maps gain their value in three ways: • As a way of recording and storing information • As a means of analyzing locational distributions and spatial patterns • As a method of presenting information and communicating findings http://quake.usgs.gov/prepare/alameda.html
Layout: Map Elements Inset map Scale Author North Arrow Data Source Map Body Projection Legend Grid Title
Next Weeks • Next week: • Creating spatial data • GPS and geocoding
Your Workspace Logging on • User: !workshopuser • Password: WRKshop USR! Working Folder: • Create a folder that all of your work will be stored in • C:\Workspace\YOURNAME • Copy the data into this folder Data • Z:\ESPM9