Download

1 / 15
150 likes | 221 Vues
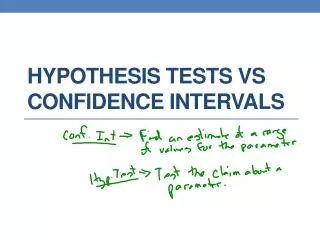
Linking tests to confidence intervals (and other issues). (Session 10). Learning Objectives. By the end of this session, you will be able to explain how results of a test of hypothesis relate to confidence interval carry out a test for a population proportion

E N D
Linking tests to confidence intervals (and other issues) (Session 10)
Learning Objectives By the end of this session, you will be able to • explain how results of a test of hypothesis relate to confidence interval • carry out a test for a population proportion • describe what is meant by one-sided and two-sided tests • explain other general issues underlying hypothesis tests
An example Consider the following data giving rainfall amounts (mm) during the first 10 days in May at 10 closely located rainfall stations a particular site 13.5 10.0 29.7 69.3 38.6 15.8 46.2 4.80 30.2 39.1 Average rainfall at site was previously 20 mm Does current data indicate a change? Need to test H0 : = 20 mm versus H1 : 20 mm
An example Summary statistics for the data are: Mean = 29.72, s = 19.64, n = 10 Hence standard error of mean = s/n = 6.21 Under the null hypothesis, we find What do we now do in order to make conclusions concerning H0?
Steps using Statistical Tables Compare t-value of 1.56 with values of the t-distribution with 9 d.f. 5% (2-sided) value from t distribution with 9 d.f. is 2.26. This is larger than the t-statistic above. We conclude we have insufficient evidence to reject H0. i.e. Insufficient evidence to claim that the average rainfall is no longer 20 mm.
Link to confidence interval 95% C.I. for mean rainfall is (15.67, 43.76) Hypothesis is H0 : = 20 mm ------(--------x--------)------- Insufficient evidence 15.7 43.8 to reject null hypo. =20 at 5% sig. level ------(--------x--------)------- Strong evidence to 15.7 43.8 reject null hypothesis =0 at 5% sig. level 5% significance level: 1 in 20 chance of wrongly rejecting null hypothesis = Prob(Type I error).
Test for a single proportion e.g. An organisation which markets a certain type of seed claims that 85% of their seeds germinate. Is this claim justified? To test the claim, 200 seeds are kept under conditions favourable to germination It is found that 176 germinate. Do these results support the claim made? Need to test: H0: p = 0.85 vs H1: p 0.85
Test for a single proportion We have seen in Session 06 that the distn of sample proportion can be approximated by the normal distribution if n is large. i.e. has a standard normal distribution. The test statistic above gives Insufficient evidence to reject H0.
Comments about hypo. tests Can rarely prove that H0 is true. 1. A p-value lower than 5% is • generally taken as reasonable evidence to reject the null hypothesis • but dangerous to stick rigidly to any particular cut-off point Alternative ways of reporting are: • p <0.10 is “borderline” – unclear result • p <0.05 is “statistically significant” • p <0.01 is “highly significant”
Comments - continued 2. Freak results can sometimes occur, e.g. • relative to what the summary statistics show, an unexpectedly low p-value may result. This suggests that H0 is unlikely, but not impossible and could be the result of too large a sample size. • large p-value might indicate the need to collect more data, and/or interpret in light of other findings. 3. If we carry out many significance tests, it is likely that at least one will give a low p-value, even if H0 is true.
Comments - continued 4. If we are unable to reject the null hypothesis, this could be because: • hypothesis is true • we have not collected a large enough sample to test the hypothesis effectively • there is so much variability in the data, not compensated for by the sample size used
Comments - continued 5. A hypothesis test may be one-sided or two-sided. i.e. alternative is in one direction only. e.g. H0 : mean = 2900 H1 : mean > 2900 • One sided tests should only be done if there are strong a priori reasons to expect, or attach meaning to the alternative hypothesis.
In conclusion… • Use significance testing, but don’t overuse • For example don’t spend too much time testing hypotheses that are obviously false. • Analyses should involve both confidence intervals and hypothesis tests • interpret results of both • in light of sample size • Significance testing is useful • at a preliminary stage • in more complicated situations such as in analysis of variance and regression (see Module H8)
References • Mead, R., Curnow R.N. and Hasted A.M. (2003). Statistical Methods in Agriculture and Experimental Biology. 3rd ed. Chapman and Hall/CRC. • McClave, J.T. and Sincich T. (2006). A First Course in Statistics. 9th edn. Prentice Hall. • McClave, J.T. and Sincich T. (2006). Statistics. 10th edn. Prentice Hall.