Download
1 / 26
260 likes | 378 Vues
Monitoring Road-Watershed Performance. An Initiative for Efficient and Effective Road Performance Monitoring: Combine effort to complete DSRs and INFRA to achieve road performance monitoring. mj furniss, PNW. 2005. Roads are a focus of watershed monitoring.

E N D
Monitoring Road-Watershed Performance An Initiative for Efficient and Effective Road Performance Monitoring: Combine effort to complete DSRs and INFRA to achieve road performance monitoring mj furniss, PNW. 2005
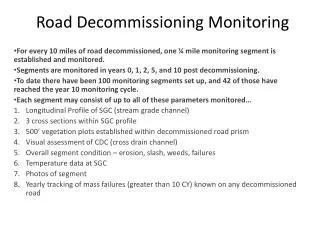
Roads are a focus of watershed monitoring • But roads vary greatly in performance • Most do not fail • Failures tend to cluster in areas of inherent instability
Why? • Failure sites create a useful dataset for defining road performance through time • Failures define the limits of practice in various landscape situations • When experienced road managers retire, mission-critical knowledge could be conserved
Why? • Little added effort for substantial value returned • INFRA in place and working • DSRs completed • Related monitoring
What you get • Ability to determine thresholds of performance • Ability to determine relative risk of failure • Quantitative description of risks
Calawah R. N. Fk. Headwaters Pistol Cr. Bonidu Cr.
Use Topograpy to Define Landscape Types for Chi-square Analysis Slope:<=15%, 15-30%, 30-45%, >45%Slope Position:<=20%, 20-55%, 55-85%, 85-100%Distance to Stream:<34m, 34-74m, 74-135m, <=135m
Chi-Square Results: Landscape types with fewer failures than expected were generally in gentler slope areas; those at lower slope positions and further from streams. Types with more failures than expected were generally at higher slope positions, steeper slopes, and closer to streams.
A Need for More Specific Risk Information Logistic Regression Modelling: • Combine 509 known failures with 1008 randomly selected locations. • Use slope, slope position, and stream proximity to estimate relative risk of road-related landslides.
Logistic Regression Model:ln(odds) = -1.8802 + 0.0238Slope + 0.0192Slope Position – 0.016Distance + 0.0001SlopeDistance
Slope 7% Slopos 4% Distance 27m Landslide Odds 19X Reference Segment 95% CL: 7, 51 Slope 23% Slopos 19% Distance 27m Landslide Odds 39X Reference Segment 95% CL: 15, 100 Reference Segment: Slope 3% Slpos 8% Distance 213m Relative Odds of Road-Related Landslides
127 167 17 72 73 65 50 53 Relative Odds Compared to 2% Slope, 2% Slope Position, 200m to Stream
How you get it… • Add DSR points and attributes to INFRA • Attributes of failure type, cause, coarse magnitude
How you get it • Modify description block in DSR to include: Failure type Cause Volume (quantity classes) • Total • To stream • To riparian area (within 50 m)
Cause Attributes…Questions • Perpetrator or innocent bystander? • Context • Impact Sometimes roads catch and preventsediment delivery
Other road monitoring Use categories created in this effort for consistency and combined analysis