Download
1 / 15
150 likes | 274 Vues
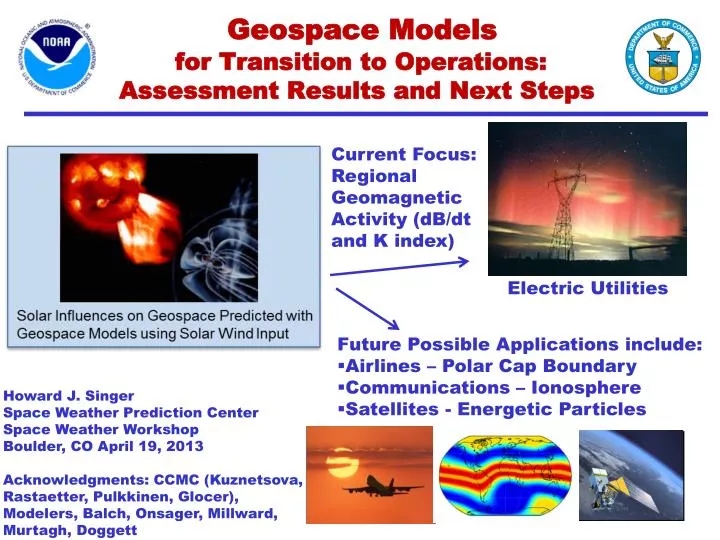
Current Focus: Regional Geomagnetic Activity (dB/dt and K index). Geospace Models for Transition to Operations: Assessment Results and Next Steps. Electric Utilities. Future Possible Applications include: Airlines – Polar Cap Boundary Communications – Ionosphere

E N D
Current Focus: Regional Geomagnetic Activity (dB/dt and K index) Geospace Models for Transition to Operations: Assessment Results and Next Steps Electric Utilities • Future Possible Applications include: • Airlines – Polar Cap Boundary • Communications – Ionosphere • Satellites - Energetic Particles Howard J. Singer Space Weather Prediction Center Space Weather Workshop Boulder, CO April 19, 2013 Acknowledgments: CCMC (Kuznetsova, Rastaetter, Pulkkinen, Glocer), Modelers, Balch, Onsager, Millward, Murtagh, Doggett
Electric Power Impacts – October, 2003 Sweden: - Power outage - Transformer heating in nuclear plant United States: - Power reduced at nuclear facilities to mitigate impacts South Africa: - 14 transformers damaged - $60 million impact - Basic commerce and security impaired
Why Regional Forecasts? Halloween Storms Example • GIC impacts were more significant in Northern Europe where heating in a nuclear plant transformer was reported and a power system failure occurred on 30 October in Malmo, Sweden • A representative from the North American Electric Reliability Corporation (NERC) commented: “Although the bulk electric system was not significantly affected by the solar activity, some systems reported higher than normal GIC’s that resulted in fluctuations in the output of some generating units, while the output of other units was reduced in response to the K-index forecast.” Responses to warnings included reducing system load, disconnecting system components, and postponing maintenance. Long intervals of high Kp, yet…effects regional South Africa Transformer overheating 15 Transformers damaged
Science BackgroundSOLAR WIND – INDUCED ELECTRIC CURRENTS FLOWING IN THE MAGNETOSPHERE Credit: Kivelson and Russell, Introduction to Space Physics Time varying currents in the magnetosphere and ionosphere, predicted by Geospace models, produce observed magnetic disturbances, including those on the ground (dB/dt and local K indices). Together with local geology, conductivities, and grid specific design, these magnetic disturbances can be used to calculate electric fields and geomagnetically induced currents (GICs).
Geospace Models: Transition to Operations • Goal: Evaluate Geospace models (MHD and empirical) to determine which model(s) are ready for transition to operations • Focus: Regional K and dB/dt (important to electric utilities) • Partnership: Evaluation at NASA/Goddard CCMC working with SWPC, modelers and science community Model(s) selection (FY13) by SWPC based on CCMC reports, internal and external advice, and following considerations: • Strategic Importance • Operational Significance • Implementation Readiness • Cost to Operate, Maintain, and Improve Solar Influences on GeospacePredicted with Geospace Models using Solar Wind Input
Models at CCMC Participating in GeospaceEvaluation • MHD Models: • Space Weather Modeling Framework (SWMF) - U. of Michigan • The Open Geospace General Circulation Model (Open GGCM) - University of New Hampshire • Coupled Magnetosphere-Ionosphere-Thermosphere (CMIT) - BU CISM, Dartmouth, NCAR • Grand Unified Magnetosphere-Ionosphere Coupling Simulation (GUMICS) - Finnish Meteorological Institute • (not ready for initial evaluation, but showing significant progress) • Empirical Models • Weimer Empirical Model, Va. Tech • Weigel Empirical Model, George Mason 6
Ground Magnetic Observatories used for Model Validation of Six Storms • Six Storm Events • Oct 29-30, 2003 • Dec 14-16, 2006 • Aug 31- Sep 1, 2001 • Aug 31 – Sep 1, 2005 • Apr 5-6, 2010 • Aug 5-6, 2011 Three high-latitude auroral zone stations and Three mid-latitude sub-auroral stations
Example of dB/dt Model-Data Comparisons At Three High-Latitude Stations Pulkkinen et al.: Geospace Model Transition, Space Weather Journal, submitted, 2012. Dec 14, 2006 12 UT Dec 16, 2006 00 UT Black – Model Blue - Observation
Example of Model-Data Comparisons POD and POFD for different dB/dt Thesholds integrated over high and mid-latitude stations Pulkkinen et al.: Geospace Model Transition, Space Weather Journal, submitted, 2012. Blue - POD Black – POFD
Regional K Distribution Metric Prescription Model Results in K = 5 All events, station X These results can be used by forecasters to give guidance that if model Y gives a K of 5, then there is a certain probability that station X will observe a specific K Model Y Number Occurrences Model Z 0 5 9 Stationx K Note: The opposite procedure could also be done by choosing an observed K value for a specific station and determining the distribution of model K values
Examples of Preliminary Results for Regional K K Threshold = 6 6 Models A. Glocer Definitions: Heidke Skill Score = 2(H*N-M*F)/[(H+M)*(M+N)+(H+F)*(F+N)] Critical Success Index (Threat Score) = H/(H+M+F) Probability Of Detection (POD) = H/(H+M) Probability Of False Detection (POFD) = F/(F+N) (perfect=1, no skill=0) (perfect=0)
Future Displays Some initial ideas Noon Dawn Dusk Without regional K, each vertical strip would be one Kp level (one color) Midnight Regional K scheme based on work by D. Welling, U. of Michigan Map from: http://www.genekeyes.com/WATERMAN-REVIEW/C-K-globe-5-degrees.jpg
Future Displays Some initial ideas Noon Dawn Dusk Without regional K, each vertical strip would be one Kp level (one color) Midnight Regional K scheme based on work by D. Welling, U. of Michigan Map from: http://www.genekeyes.com/WATERMAN-REVIEW/C-K-globe-5-degrees.jpg
Geospace Models: Transition to Operations Recent Accomplishments and Next Steps • Dec 2012: CCMC delivers draft report on dB/dt to SWPC; CCMC led publication submitted to Space Weather Journal • Dec 2012 - Jan 2013: SWPC reviews dB/dt report and assess ancillary model results; iterate with CCMC if additional information needed in report • Dec 2, 2012: AGU/GEM Mtg, CCMC reports on initial results from Regional K, discussions with modelers on publications and assessment • Jan-Apr 2013: complete work on Regional K, iterate with modelers, prepare publications and report • Jan-Apr 2013: SWPC discussions with modelers about implementation activities; e.g. working arrangements with modeler, intellectual property rights, explore open source code (NWS paradigm), ability to make changes to accommodate operational implementation, sharing models with operational partners; model conops and maintenance requirement… • May 2013: SWPC review regional K report and iterate as needed with CCMC • Jun – Sep 2013: SWPC utilize reports, our own review of the data (model results), additional discussions with modelers, consult with partners, and make selection.
Conclusions • Space weather customers will benefit from improved regional geomagnetic activity predictions of dB/dt and K • Auroral and ionosphere products are an additional potential outcomes • SWPC values the continuing support and expertise provided by modelers, CCMC and other partners • Additional future efforts needed for sensitivity analyses such as how model results depend on: Spatial and temporal scales, model grid size, etc. • Model evaluation has been extremely beneficial to science community by accelerating availability of new model versions at CCMC and will help to identify what is needed to improve models • Evaluation results need careful interpretation: • Different models may do better on different events • Although one model be best for chosen parameters (db/dt and K) for the specific metrics (POD, POFD, etc.), different models may do better for other parameters (e.g. substorm onset, polar cap potential, etc.) and for other metrics (timing, RMS, etc.). Therefore, the model selected, may only be “best”at this time, for SWPC’s specific evaluation factors • A model(s) selection will be made in FY13.