Download
1 / 21
340 likes | 1.57k Vues
Valuation Ratios in the Airline Industry. John Pagazani Tara Trussell Roisin Byrne. We want to determine the following: Valuation ratios to use for the airline industry Key factors which influence these ratios

E N D
Valuation Ratios in the Airline Industry John Pagazani Tara Trussell Roisin Byrne
We want to determine the following: Valuation ratios to use for the airline industry Key factors which influence these ratios How to intuitively match a given airline with a set of valuation ratios based on its strategy Objectives
To start, let’s review the background on the industry and the companies in question... Airline Industry Valuations
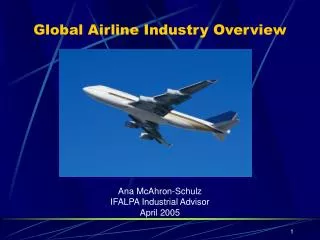
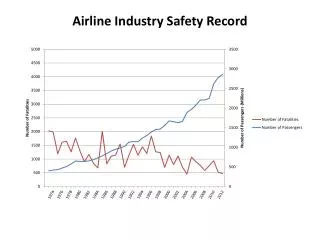
Airline Industry Overview $ 50% fare reduction Triple air traffic Airline traffic Airline fares 1978 1998
Background Long haul carrier Established in the 1920s, American was one of the first U.S. giants in the industry due to >80 acquisitions, and the largest U.S. airline based on revenues in 2000 Owns two regional airlines and also one of the largest airfreight carriers in the world Very competitive domestic market with up to nine airlines providing service on competitive routes. Strategy Pricing decisions largely affected by competition – some with lower cost structure Efficient and quiet aircraft In 2000, American Eagle regional jet fleet was increasingly aggressive Continued expansion into domestic and international route networks anchored by efficient hubs, enabled American to capitalize on any passenger traffic growth American Airlines
Background Long haul carrier Founded as the world’s first crop-dusting service in 1924. Established its domestic network via other regional carrier acquisitions – highly competitive market. In 1991, Delta entered the international markets. Largest U.S. airline in terms of aircraft departures and number of passengers served, third largest in terms of operating revenue Labor issues in 2000 – unionized workforce Strategy Variety of services – Delta Shuttle, Delta Express, Delta Connection, International alliances Not a clearly defined strategy except to offer services to everyone Delta Air Lines
Background Regional carrier Founded in 1972, Sky West operates 108 aircraft from 6 hubs Over 1000 daily departures to 68 destinations 70% of flights were jointly coded with Delta Air lines and United Airlines flights Compete with other regional airlines, low-fare carriers and larger airlines. Strong relationship with non-unionized workforce Strategy High quality customer service Joint affiliations which reduced reliance on any single major airline code Operations are enhanced and stabilized through a combination of Sky West controlled and contract flying. Committed to acquire 113 additional regional jets with operations on another 119 aircraft – dependant largely on contracts with Delta and United. Sky West Airlines
Background Hybrid carrier Founded in 1971 with three Boeing 737, Southwest operates 344 aircraft and services 57 destinations Focused on frequent flights to conveniently located and less congested airports Wait time at airport gates is less than half the industry average Operates only one type of aircraft Strategy Cost leader in the industry “no frills service” at a low price High asset utilization and tight control over operating expenses. No code-sharing relationships with other airlines Simple fare structure – low unrestricted coach fares Majority owned by its employees - Strong relationships with non-unionized workforce Southwest Airlines
Now that we have some background on the industry and the airlines, let’s look at the ratios we can use to rank them in terms of value… How do we value these airlines?
PE = f(earnings growth – cost of equity capital) A firm with a HIGH PE ratio is expected to exhibit HIGH earnings growth (over and above costs and inflation.) A firm with a LOW PE ratio will not exhibit earnings above the current level of earnings (approx. = rate of inflation. plus costs) Determinants of Price-Earnings (PE) Ratio
ROE = f(Dupont relationships) = f(NI/Sales X Sales/Assets X Assets/SE) = f(Profit margin + asset turnover + leverage) = Earnings/equity Determinants of Return on Equity (ROE)
PB = f[future abnormal ROE + growth in equity(book value) – cost of equity capital] A firm with a HIGH PB ratio is expected to grow and expand its asset base over and above the CEC A firm with a LOW PB ratio is not expected to grow beyond the rate of inflation Determinants of Price-to-Book (PB) Ratio
Once we determine one of the ratios, the others can be solved because they are linked by return on stockholders’ equity (ROE): PE (price/earnings) x ROE (earnings/equity) = PB (price/equity) Relationship between the Ratios
Now, let’s take our knowledge of how the ratios work and apply them to what we know about the airlines… The Four Airlines
We do not have adequate information to precisely CALCULATE the ratios, so we want to use our intuition to gauge which airline best fits each description below: Exercise: Identify the Airlines
American = High competition for routes, low historical ROE, low PE as earnings growth not over CEC, PB <1 since ROE < CEC Delta = High competition for routes, average historical ROE, ROE > CEC, so PB >1, low PE Southwest = flexible, non-union labour, low cost strategy sustainable, high PB, high PE due to presumably sustainable long-term earnings growth Skywest = Serves larger air carriers who can also compete directly, depends on Delta/United for business ~ maybe earnings not as sustainable, high ROE, ROE > CEC = PB much greater than one, PE is high also, but limited sustainability Possible Results and Discussion
We have seen that by a) reviewing the strategies and b) estimating the direction and magnitude of earnings and asset base growth, we can intuitively rank airline companies using our PE and PB valuation multiples. Summary