Download
1 / 17
170 likes | 344 Vues
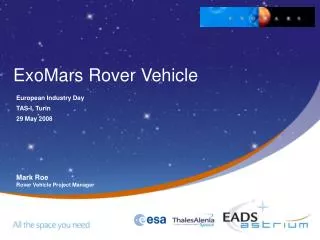
Exomars 2010 EDLM Micro MIMA experiment G. Bellucci, B. Saggin, D. Biondi, A. Grigoriev, L. Zasova, N. Ignatiev INAF-IFSI, Politecnico di Milano, IKI Space Center. MIMA/ Exomars rover Mass: 1.3 Kg Power : 10 W. Micro MIMA concept. Sun. Fish eye telescope. Detector.

E N D
Exomars 2010 EDLM Micro MIMA experiment G. Bellucci, B. Saggin, D. Biondi, A. Grigoriev, L. Zasova, N. Ignatiev INAF-IFSI, Politecnico di Milano, IKI Space Center
MIMA/Exomarsrover • Mass: 1.3 Kg • Power: 10 W
Micro MIMA concept Sun Fisheyetelescope Detector Doublependulum interferometer Proximity Electronics Note: Digitalelectronics, mass memory and DC-DC convertersprovidedby EDLM
Methane detection Expectedcontrast: 0.6% for 10 ppb and 0.9 % for 20 ppb. 0.7 % One single measurement (3 sec) detects a contrastof 0.4% .
Methane detection Expectedcontrast: 0.9% for 10 ppb and 1.3 % for 20 ppb. 0.9 % One single measurement (3 sec) detects a contrastof 3 % .
Methane detection CH4 band at spectral resolution 1 cm-1, its depth is 0.5% with respect to the continuum. For Micro-MIMA, with integrating time 1.5 hours the minimum detectable band depth is 0.01%.
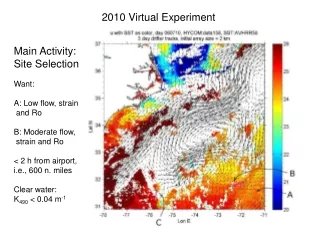
Fluxfrom the hemisphere, Sun in the FOV, dustopacity 0.15, 1.5, 15. Spectralresolution 2 cm-1. dust= 0.15 at 2 µm – Sun at zenith dust= 1.5 at 2 µm – Sun at zenith dust= 15 at 2 µm – Sun at zenith dust= 15 at 2 µm – Sun at 80° CO detection
dust= 15 at 2 µm – Sun at 80° CO CO detection
Science case: conclusions • Martian spectra integrated over the hemisphere were calculated for observations from the surface into the upper hemisphere with Sun in the FOV with spectral resolution of 2 cm-1 • The bands of CO2, H2O, CO are observed at any dust opacity (calculation made from 0.15 to 15) • The intensity of radiation decreases with increasing of dust opacity • Depth of the CO bands (Depth= I(v) / I(cont) ) is of 5 – 8%, they may be observed from a single spectrum • - Dust opacity may be retrieved even from a single spectrum • - Surface pressure (may be) • - As far as CH4 is concerned, for 1.5 hour averaging and 10 ppb abundance, S/N is 50. Minimum detectable abundance 1-2 ppb.
Size 85 45 85
Environmentalspecifications • Operating temperature range: -120÷40°C • Non-operating temperature range: -130÷120°C (TBC detector) • Design load 1000 m/s2
Workshop Exomars 2016 D.Biondi Block Diagram
Data rate/Volume A factor x2 ofcompressioniseasilyobtainedbydigital processing. On board FFT capabilities can improve the compressionfactor up to x8