Download
1 / 1

E N D
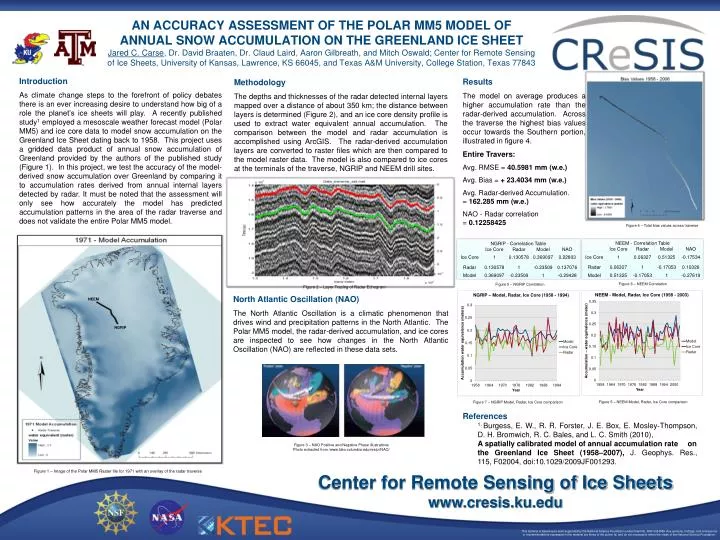
AN ACCURACY ASSESSMENT OF THE POLAR MM5 MODEL OF ANNUAL SNOW ACCUMULATION ON THE GREENLAND ICE SHEETJared C. Carse, Dr. David Braaten, Dr. Claud Laird, Aaron Gilbreath, and Mitch Oswald; Center for Remote Sensing of Ice Sheets, University of Kansas, Lawrence, KS 66045, and Texas A&M University, College Station, Texas 77843 Introduction As climate change steps to the forefront of policy debates there is an ever increasing desire to understand how big of a role the planet’s ice sheets will play. A recently published study1employed a mesoscale weather forecast model (Polar MM5) and ice core data to model snow accumulation on the Greenland Ice Sheet dating back to 1958. This project uses a gridded data product of annual snow accumulation of Greenland provided by the authors of the published study (Figure 1). In this project, we test the accuracy of the model-derived snow accumulation over Greenland by comparing it to accumulation rates derived from annual internal layers detected by radar. It must be noted that the assessment will only see how accurately the model has predicted accumulation patterns in the area of the radar traverse and does not validate the entire Polar MM5 model. Results The model on average produces a higher accumulation rate than the radar-derived accumulation. Across the traverse the highest bias values occur towards the Southern portion, illustrated in figure 4. Entire Travers: Avg. RMSE = 40.5981 mm (w.e.) Avg. Bias = + 23.4034 mm (w.e.) Avg. Radar-derived Accumulation. = 162.285 mm (w.e.) NAO - Radar correlation = 0.12258425 Methodology The depths and thicknesses of the radar detected internal layers mapped over a distance of about 350 km; the distance between layers is determined (Figure 2), and an ice core density profile is used to extract water equivalent annual accumulation. The comparison between the model and radar accumulation is accomplished using ArcGIS. The radar-derived accumulation layers are converted to raster files which are then compared to the model raster data. The model is also compared to ice cores at the terminals of the traverse, NGRIP and NEEM drill sites. Figure 4 – Total bias values across traverse Figure 6 – NEEM Correlation Figure 5 – NGRIP Correlation Figure 2 – Layer Tracing of Radar Echogram North Atlantic Oscillation (NAO) The North Atlantic Oscillation is a climatic phenomenon that drives wind and precipitation patterns in the North Atlantic. The Polar MM5 model, the radar-derived accumulation, and ice cores are inspected to see how changes in the North Atlantic Oscillation (NAO) are reflected in these data sets. NEEM NGRIP Figure 5 – NEEM Model, Radar, Ice Core comparison Figure 7 – NGRIP Model, Radar, Ice Core comparison • References • 1. Burgess, E. W., R. R. Forster, J. E. Box, E. Mosley‐Thompson, D. H. Bromwich, R. C. Bales, and L. C. Smith (2010), • A spatially calibrated model of annual accumulation rate on the Greenland Ice Sheet (1958–2007), J. Geophys. Res., 115, F02004, doi:10.1029/2009JF001293. Figure 3 – NAO Positive and Negative Phase illustrations Photo extracted from /www.ldeo.columbia.edu/res/pi/NAO/ Figure 1 – Image of the Polar MM5 Raster file for 1971 with an overlay of the radar traverse