Download
1 / 1
10 likes | 114 Vues
Evaluation of satellite retrievals of O 3 and HNO 3 in the upper troposphere: Application to ozone production efficiency

E N D
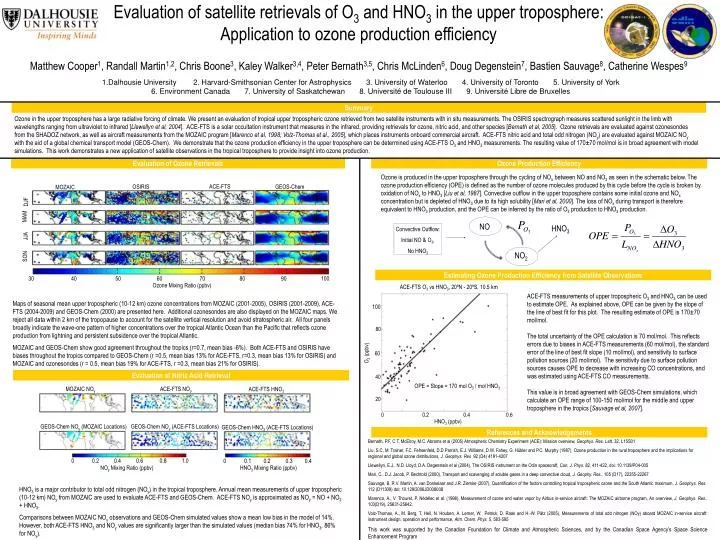
Evaluation of satellite retrievals of O3 and HNO3 in the upper troposphere: Application to ozone production efficiency Matthew Cooper1, Randall Martin1,2, Chris Boone3, Kaley Walker3,4, Peter Bernath3,5, Chris McLinden6, Doug Degenstein7, Bastien Sauvage8, Catherine Wespes9 • Dalhousie University 2. Harvard-Smithsonian Center for Astrophysics 3. University of Waterloo 4. University of Toronto 5. University of York • 6. Environment Canada 7. University of Saskatchewan 8. Université de Toulouse III 9. Université Libre de Bruxelles Summary Ozone in the upper troposphere has a large radiative forcing of climate. We present an evaluation of tropical upper tropospheric ozone retrieved from two satellite instruments with in situ measurements. The OSIRIS spectrograph measures scattered sunlight in the limb with wavelengths ranging from ultraviolet to infrared [Llewellyn et al, 2004]. ACE-FTS is a solar occultation instrument that measures in the infrared, providing retrievals for ozone, nitric acid, and other species [Bernath et al, 2005]. Ozone retrievals are evaluated against ozonesondes from the SHADOZ network, as well as aircraft measurements from the MOZAIC program [Marenco et al, 1998; Volz-Thomas et al., 2005], which places instruments onboard commercial aircraft. ACE-FTS nitric acid and total odd nitrogen (NOy) are evaluated against MOZAIC NOy with the aid of a global chemical transport model (GEOS-Chem). We demonstrate that the ozone production efficiency in the upper troposphere can be determined using ACE-FTS O3 and HNO3 measurements. The resulting value of 170±70 mol/mol is in broad agreement with model simulations. This work demonstrates a new application of satellite observations in the tropical troposphere to provide insight into ozone production. Evaluation of Ozone Retrievals Ozone Production Efficiency Ozone is produced in the upper troposphere through the cycling of NOx between NO and NO2 as seen in the schematic below. The ozone production efficiency (OPE) is defined as the number of ozone molecules produced by this cycle before the cycle is broken by oxidation of NOx to HNO3 [Liu et al, 1987]. Convective outflow in the upper troposphere contains some initial ozone and NOx concentration but is depleted of HNO3 due to its high solubility [Mari et al, 2000]. The loss of NOx during transport is therefore equivalent to HNO3 production, and the OPE can be inferred by the ratio of O3 production to HNO3 production. ACE-FTS OSIRIS GEOS-Chem MOZAIC DJF MAM NO JJA HNO3 Convective Outflow: Initial NO & O3, No HNO3 SON NO2 Estimating Ozone Production Efficiency from Satellite Observations 30 40 50 60 70 80 90 100 Ozone Mixing Ratio (ppbv) ACE-FTS O3 vs HNO3, 20ºN - 20ºS, 10.5 km ACE-FTS measurements of upper tropospheric O3 and HNO3 can be used to estimate OPE. As explained above, OPE can be given by the slope of the line of best fit for this plot. The resulting estimate of OPE is 170±70 mol/mol. The total uncertainty of the OPE calculation is 70 mol/mol. This reflects errors due to biases in ACE-FTS measurements (60 mol/mol), the standard error of the line of best fit slope (10 mol/mol), and sensitivity to surface pollution sources (20 mol/mol). The sensitivity due to surface pollution sources causes OPE to decrease with increasing CO concentrations, and was estimated using ACE-FTS CO measurements. This value is in broad agreement with GEOS-Chem simulations, which calculate an OPE range of 100-150 mol/mol for the middle and upper troposphere in the tropics [Sauvage et al, 2007]. Maps of seasonal mean upper tropospheric (10-12 km) ozone concentrations from MOZAIC (2001-2005), OSIRIS (2001-2009), ACE-FTS (2004-2009) and GEOS-Chem (2000) are presented here. Additional ozonesondes are also displayed on the MOZAIC maps. We reject all data within 2 km of the tropopause to account for the satellite vertical resolution and avoid stratospheric air. All four panels broadly indicate the wave-one pattern of higher concentrations over the tropical Atlantic Ocean than the Pacific that reflects ozone production from lightning and persistent subsidence over the tropical Atlantic. MOZAIC and GEOS-Chem show good agreement throughout the tropics (r=0.7, mean bias -6%). Both ACE-FTS and OSIRIS have biases throughout the tropics compared to GEOS-Chem (r =0.5, mean bias 13% for ACE-FTS, r=0.3, mean bias 13% for OSIRIS) and MOZAIC and ozonesondes (r = 0.5, mean bias 19% for ACE-FTS, r =0.3, mean bias 21% for OSIRIS). 100 80 O3 (ppbv) 60 Evaluation of Nitric Acid Retrieval 40 OPE = Slope = 170 mol O3 / mol HNO3 MOZAIC NOy ACE-FTS NOy ACE-FTS HNO3 20 0 0.2 0.4 0.6 HNO3 (ppbv) GEOS-Chem NOy (MOZAIC Locations) GEOS-Chem NOy (ACE-FTS Locations) GEOS-Chem HNO3 (ACE-FTS Locations) References and Acknowledgements Bernath, P.F, C.T. McElroy, M.C. Abrams et al (2005) Atmospheric Chemistry Experiment (ACE): Mission overview, Geophys. Res. Lett. 32, L15S01 Liu, S.C, M. Trainer, F.C. Fehsenfeld, D.D Parrish, E.J. Williams, D.W. Fahey, G. Hübler and P.C. Murphy (1987), Ozone production in the rural troposphere and the implications for regional and global ozone distributions, J. Geophys. Res 92 (D4) 4191-4207 Llewellyn, E.J., N.D. Lloyd, D.A. Degenstein et al (2004), The OSIRIS instrument on the Odin spacecraft, Can. J. Phys. 82, 411-422, doi: 10.1139/P04-005 Mari, C., D.J. Jacob, P. Bechtold (2000), Transport and scavenging of soluble gases in a deep convective cloud, J. Geophy. Res., 105 (D17), 22255-22267 Sauvage, B, R.V. Martin, A. van Donkelaar and J.R. Ziemke (2007), Quantification of the factors controlling tropical tropospheric ozone and the South Atlantic maximum, J. Geophys. Res. 112 (D11309) doi: 10.129/2006JD008008 Marenco, A., V. Thouret, P. Nédélec et al. (1998), Measurement of ozone and water vapor by Airbus in-service aircraft: The MOZAIC airborne program, An overview, J. Geophys. Res., 103(D19), 25631-25642. Volz-Thomas, A., M. Berg, T. Heil, N. Houben, A. Lerner, W. Petrick, D. Raak and H.-W. Pätz (2005), Measurements of total odd nitrogen (NOy) aboard MOZAIC in-service aircraft: instrument design, operation and performance, Atm. Chem. Phys. 5, 583-595 This work was supported by the Canadian Foundation for Climate and Atmospheric Sciences, and by the Canadian Space Agency’s Space Science Enhancement Program 0 0.2 0.4 0.6 0.8 1.0 NOy Mixing Ratio (ppbv) 0 0.1 0.2 0.3 0.4 HNO3 Mixing Ratio (ppbv) HNO3 is a major contributor to total odd nitrogen (NOy) in the tropical troposphere. Annual mean measurements of upper tropospheric (10-12 km) NOy from MOZAIC are used to evaluate ACE-FTS and GEOS-Chem. ACE-FTS NOy is approximated as NOy = NO + NO2 + HNO3. Comparisons between MOZAIC NOy observations and GEOS-Chem simulated values show a mean low bias in the model of 14%. However, both ACE-FTS HNO3 and NOy values are significantly larger than the simulated values (median bias 74% for HNO3, 86% for NOy).