Download
1 / 12
120 likes | 213 Vues
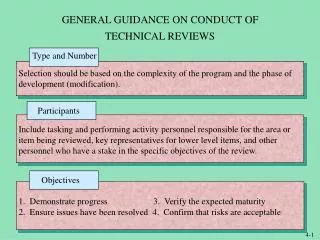
Technical Guidance on Biomass Combustion. John Abbott. Introduction. New Technical Guidance is being prepared for Local Authority Review and Assessment to replace TG(03)

E N D
Technical Guidance on Biomass Combustion John Abbott
Introduction • New Technical Guidance is being prepared for Local Authority Review and Assessment to replace TG(03) • There have been widespread concerns that particulate matter and oxides of nitrogen emissions emissions from biomass combustion will hinder the achievement of air quality objectives • The new Technical Guidance includes screening tools to assess whether there is a risk that biomass combustion will lead to exceedence of the air quality objectives for Local Authority review and Assessment • If the screening tools indicate that there is a risk of exceeding the objectives then the local authority should carry out more detailed assessment. • This presentation describes the development of the screening tools
Air quality objectives • Air quality strategy 2007 sets the following objectives: • An annual mean PM10 concentration of 40 ug/m3 gravimetric to be achieved by 31 December 2004 • A 24 hour mean PM10 concentration of 50 ug/m3 not to be exceeded more than 35 times a year to be achieved by 31 December 2004 • An annual mean PM10 concentration of 18 ug/m3 gravimetric to be achieved in Scotland by 31 December 2010 • A 24 hour mean PM10 concentration of 50 ug/m3 not to be exceeded more than 7 times a year to be achieved in Scotland by 31 December 2010 • An annual mean PM2.5 concentration of 25 ug/m3 (12 ug/m3 in Scotland) to be achieved by 2020 • A target of 15% reduction in PM2.5 concentrations in urban background areas between 2010 and 2020 • An annual mean nitrogen dioxide concentration of 40 ug/m3 to be achieved by 31 December 2005 • An hourly mean nitrogen dioxide concentration of 200 ug/m3 not to be exceeded more than 18 times a year to be achieved by 31 December 2005
Screening tools • Requirements Assessment of individual biomass installations • Small installations not covered by PPC regulation. Typically up to about 3 MW thermal , but potentially up to 20 MW • Stack height thresholds Assessment of combined effects of many biomass boilers Existing tools LAQM.TG(03) industrial nomographs- for larger plant Chimney Heights Memorandum- not for PM Technical Guidance D1- different air quality objectives LAQM.TG(03) solid fuel nomographs- not representative of current boiler performance
Stack height nomographs • ADMS dispersion modelling • Nominal 1 g/s emission rate • Range of stack diameters 0.1, 0.2, 0.5 and 1 m • Range of stack heights 10.6-40 m • Nominal 10 m cubical building • Discharge 100 C, intended to be conservative • Discharge flowrates based on natural draught requirements for chimneys- will be conservative for mechanical draught • Hourly sequential meteorological data for Heathrow 2005 and 2006 • Surface roughness 1 m • Annual mean, 90th percentile of 24 hour means, 99.8th percentile of hourly means • Receptors at 10 m x 10 m resolution on a 1 km x 1 km domain
Treatment of modelling results • Effective stack height calculated: for C<2.5H; otherwise U=C, where: H is the building height C is modelled stack height Emission rate E g/s that would give a maximum ground level concentration of 1 ug/m3 calculated as 1/Cmax Log E plotted against Log U for each stack diameter. Cubic polynomials fitted to the data.
Stack height nomographs • Annual mean nomograph, similar nomographs for 99.8th percentile hourly mean and 90th percentile 24 hour mean
To use the nomographs • Calculate maximum emission rate at boiler capacity, E • Guidance summarises emission factors from Corinair • Estimate background concentrations • 1 km maps provided by the LAQM website • Measurements Calculate a background adjusted emission rate to scale to the available headroom Ea=E/(L-G) where L is the limit value and G is the background concentration Look up the required effective stack height from the nomograph for the appropriate stack diameter Correct the actual stack height for nearby buildings, C=1.6(U-H) Is the corrected stack height more than the required effective stack height?
Combined effects nomograph • Dispersion modelling • ADMS4 • Unit emission for volume sources 10 m deep and 1 km2, 4 km 2 and 16 km2 representing “village”, “small town”, “large town” • Hourly sequential meteorological data for Heathrow, 2006 • Surface roughness 1 m • Results • 2.5 tonnes/km2 per annum emission in “village” • 1.9 tonnes/km2 per annum emission in “small town” • 1.8 tonnes/km2 per annum emission in “large town” • Will increase annual mean concentrations by 1 ug/m3 • Basis of the assessment is the worst 500 x 500 m square in the local authorities area: nomographs are on a 500 x 500 m square basis
Using the nomographs • Nomographs provide estimates of the annual rate of emission that would lead to exceedence of the objectives • Local authorities are required to estimate the number of households and the area of office, warehouse etc. heated by solid fuel in the worst 500 m square • Guidance provides estimates of emissions per household and per hectare of service sector space based on BERR statistics of heat demand and CORINAIR emission factors for a range of appliance types and solid fuels • Calculate total emissions from sources in the 500 msquare and compare with the annual rate of emission that would lead to exceedence of the objectives
Conclusion • Dispersion modelling has been used to develop some simple screening tools for local authorities to assess the impact on air quality of individual biomass combustion installations and the combined effect of many installations. • Consultation draft of the new Technical guidance to be published shortly • Work in hand for Scottish Government to provide further guidance for objectives in Scotland