Download
1 / 21
210 likes | 336 Vues
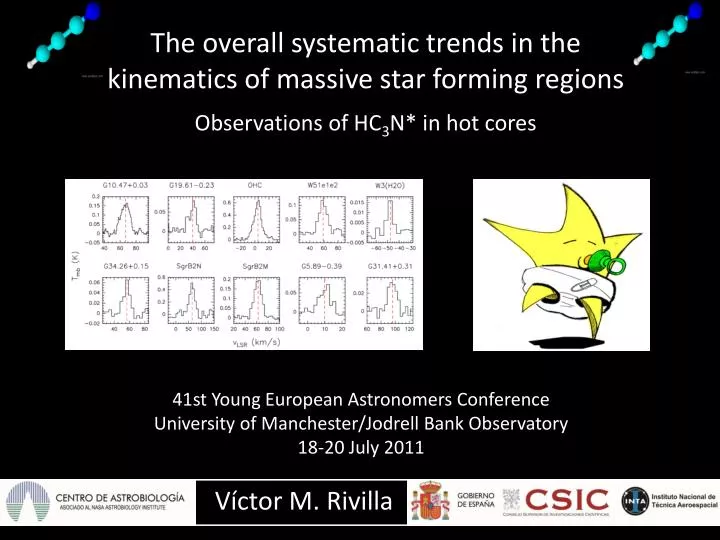
The overall systematic trends in the kinematics of massive star forming regions Observations of HC 3 N* in hot cores. 41st Young European Astronomers Conference University of Manchester/Jodrell Bank Observatory 18-20 July 2011. Víctor M. Rivilla. Hot cores: the cradle of massive stars.

E N D
Theoverallsystematictrends in thekinematics of massivestarformingregions Observations of HC3N* in hotcores 41st Young European Astronomers Conference University of Manchester/Jodrell Bank Observatory 18-20 July 2011 Víctor M. Rivilla
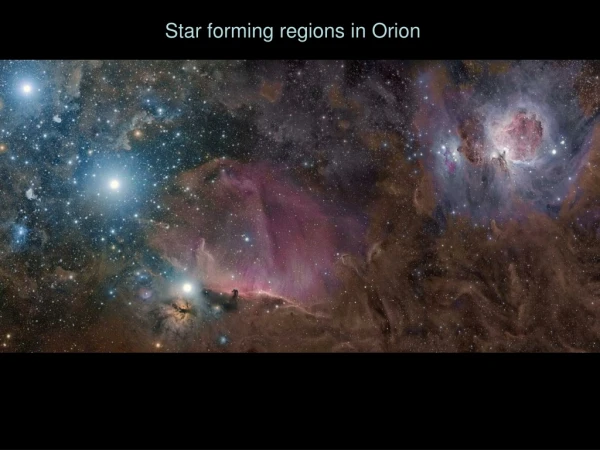
Hot cores: the cradle of massive stars ■ Understanding the formation of massive stars requires knowledge of the physical conditions of the places where they are born. ■Hot cores (HC) are deeply embedded, dense (n > 107cm-3), hot (T > 200 K), and chemically rich condensations, considered to be the earliest stages of massive star formation. ■ Contain hot dust very bright mid-IR (10-50 μm) emitters. ■ HC are hidden behind large extinction (>25 mag) even in the mid-IR, preventing their direct observation at these wavelengths.
Why HC3N? ■ Indirect observations of the kinematics and the physical properties of the inner parts of the hot cores are possible by measuring the rotational lines of molecules in vibrationally excited levels. ■ Rotational lines are emitted at radio wavelengths, unaffected by the dust extinction. ■ The excitation of these lines is due to mid-IR radiation . ■ Cyanoacetilene (HC3N) is a very well suited molecule to study the hot cores : • abundance enhanced due to the evaporation of the grain mantles. • trace dense gas. • vibrational levels are excited by IR radiation in the 15-50 μm range. Wyrowski et al. (1999) ■ Rotational transitions from the vibrationally excited lines of HC3N (HC3N* hereafter) probe the high density hot gas and dust regions surrounding the very young massive stars .
Previous observations and results ■ de Vicente et al. (2000) found that the HC3N* lines (1v5, 1v6 and 1v7) show in Sgr B2N and Sgr B2M massive HCs: •Linewidth-Eupp trend: a systematic trend in their linewidths to decrease with increasing energy of the upper energy level (Eupp) involved in the transition 1v6 line (higher excitation) HW2 Cep A Jímenez-Serra et al. (2009) 1v7 line (lower excitation) • Size-Eupp trend: differences in the morphology of their emission, with the lines with lower Eupp being more spatially extended than those with higher Eupp.
New observations: our sample of hot cores ■ In order to confirm whether linewidth-Eupp and Eupp-size trends represent a general behavior of the HC3N* emission toward high-mass star forming regions, we have extend out study to a more complete sample of hot cores. Rivilla et al. (in preparation) ■ NRAO Arizona Radio Observatory (ARO) 12m (Kitt Peak) ■ Angular resolution: ~ 38" ■ J=18-17 rotational transition (2mm) of HC3N* from 2 different vibrational levels (1v7 and 1v6)
HC3N* spectra toward the sample of hot cores HC3N 1v7,1f ν=164.39 GHz Eup=396K lower excitation HC3N 1v6,1e ν=164.02 GHz Eup=793K Rivilla et al. (in preparation) higher excitation
LTE analysis of spectral lines: χ2methodresults ■ We have used our data along with data from the literature to characterize the Tex , N and size of the emitting region. Orion Hot Core SgrB2 M SgrB2 N G10.47+0.03
1) Size – Eupptrend ■ We have redone the LTE analysis distinguishing between low excitation (Eup<400-500 K) and high excitation (Eup >400-500K) lines. ■ The result confirm that low excitation lines arise from a more extended and colder component, and higher excitation lines from a more compact and hotter region. Low excitation High excitation Rivilla et al. (in preparation) 1v6 line (higher excitation) HW2 Cep A Low excitation (lower Tex and more extended) Jímenez-Serra et al. (2009) High excitation (higher Tex and more concentrated) 1v7 line (lower excitation)
1) Size – Eupptrend Low excitation (lower Tex and more extended) High excitation (higher Tex and more concentrated) ■ These morphology differences could be explained as an excitation effect produced by the radiative pumping of the levels of HC3N by the dust-processed IR radiation coming from the massive star(s) within the core. ■ The levels with higher Eupp are only excited in the inner parts around massive stars. ■ The levels with lower Eupp can be pumped at larger distances.
2) Confirmation of the Δv – Eupptrend ■ Our results show that the linewidth-Eupp trend observed towards SgrB2 N and SgrB2 M by de Vicente (2002) are also found in our more complete sample of hot cores . Rivilla et al. (in preparation) Low excitation (lower Tex and more extended) + High excitation (higher Tex and more concentrated) +
Kinematics: ruling out… ■ Our result seems to rule out gravitational collapse or keplerian rotation (expected to decrease the linewidth with increasing size) as the major kinematic ingredients in these regions. COLLAPSE KEPLERIAN ROTATION
Molecular outflows? ■ The presence of molecular outflows is very common in star formation regions. The broader lines from the lower vibrational levels of HC3N* (with more extended size emission) could probe shocked gas associated with massive molecular outflows, as that reported toward the Orion hot core (de Vicente et al. 2002). Broadening by outflows The higher vibrational levels would be sensitive only to the inner and hotter gas close to the newly born stars, less affected by outflows.
Rigidrotation? Broadening by rigid rotation vrigid =ω R The lines more extended have a higher vrigid, and hence, show a wider line. Suggested for SgrB 2 N based on proper motions of H2O masers (Reid et al., 1988)
3) Δv – luminositytrend ■ New trend between the HC3N* linewidths and the IR luminosity of the massive star forming region ■Distance-bias? The linewidth may increase with distance since the beam of the observation correspond to larger physical sizes. ■ However, there is no correlation between the HC3N* linewidth and the distance to the different sources. ■ So this correlation is a real feature of the cores. This trend, along with the one presented by Kurtz et al. (2000) between the luminosity and the total mass, links the overall gas kinematics with the global physical parameters of these regions such as luminosity and mass. Rivilla et al. (in preparation)
Δv – luminositytrend ■ This correlation may be explained by the presence of a cluster of hot cores embedded in the region, which have been formed from molecular gas with a velocity gradient. ■ Each one of these individual hot cores would contribute to the total emission with a different central velocity, broadening the lines. Cluster of less luminous hot cores ?
Future work ■ We need HC3N* interferometric observations to: • confirm directly the size-Eupp correlation. • reveal the presence of disk structures or outflows. • study with high angular resolution the kinematics of the gas, the temperature and the density distributions. • resolve the morphology of the cores cluster of cores? physical explanation for the linewidth-luminosity trend? ■ We have new VLA observations (B configuration, ̴ 0.2”) of SrgB2N & M, G10.47+0.03 and Orion Hot Core. ■ SMA observations available for scheduling (extended configuration, ̴ 1”) of W51e1e2 , G31.41+0.31, G34.26+0.15, G19.61-0.23 , G5.89-0.39.
Thanks! Víctor M. Rivilla
Theoverallsystematictrends in thekinematics of massivestarformingregions Observations of HC3N* in hotcores 41st Young European Astronomers Conference University of Manchester/Jodrell Bank Observatory 18-20 July 2011 Víctor M. Rivilla
Theoverallsystematictrends in thekinematics of massivestarformingregions Observations of HC3N* in hotcores 41st Young European Astronomers Conference University of Manchester/Jodrell Bank Observatory 18-20 July 2011 Víctor M. Rivilla
Massivestars ■ M>8M⊙■Several thousands of L⊙■ Spectral types earlier B3. ■ Short lifetimes: 107 years. ■ Fast evolution ■Main mechanical energy injection in the ISM (circumstellar disks, ionized regions, hot gas, outflows, supernovas, etc). (Panagia, 1973)
LTE analysis of spectral lines: χ2method ■ LTE is a good aproximation for HCs. beam size I I´ nd is the number of points (ie., spectral lines) np is the number of free parameters=3 ■ Free parameters: size, Tex, N ■ RESULT: set of parameters (size, Tex, N) that minimize χ2.