Download
1 / 20
200 likes | 288 Vues
Consumer Price Index. Government’s “most important” statistic Announced monthly by Bureau of Labor Statistics Measures changes in prices of goods and services over time Affects elections, economy, government policies, Social Security, pensions

E N D
Consumer Price Index • Government’s “most important” statistic • Announced monthly by Bureau of Labor Statistics • Measures changes in prices of goods and services over time • Affects elections, economy, government policies, Social Security, pensions • Bureau of Labor Statistics: “Directly affects incomes of over 80 million people”
CPI • http://www.bls.gov/news.release/pdf/cpi.pdf • How to compare prices from year to year? • Carleton’s tuition (comprehensive) 1980: $6,940 • Carleton’s tuition 2003: $34,395 • Did the price go up? What about inflation? • A dollar in 2003 doesn’t buy as much as a dollar in 1980, or a dollar in 1950, or a dollar in 1920.
Index number • Measures price relative to base period • Carleton tuition • (34395 / 6940 ) x 100 = 495.61 • “Carleton tuition index number” for 2003 with 1980 as base period is 495.61 • Tuition has increased 395.61% (almost quadrupled) since 1980 • CPI base period is 1984: “1982-184 = 100”
Student Price Index • Compare cost of the same collection of goods and services over time • Same goods and services that cost $1,525 in 1980 cost $2,850 in 2000. • Student Price Index (1980=100) is (2850/1525) x 100 = 186.89
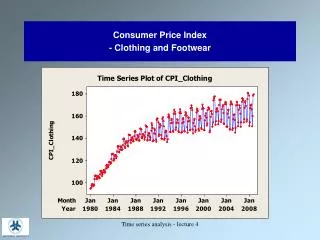
Using the CPI • CPI is a market basket price index based on hundreds of items • Allows us to convert amounts into dollars of same year • Historically 20th century was time of inflation---prices rose throughout the century increasing rapidly after 1973
CPI • ftp://ftp.bls.gov/pub/special.requests/cpi/cpiai.txt
Adjusting for changes in buying power • “Constant dollars,” “real income” means dollars represent same buying power even though they may describe different years • To convert an amount in dollars at time A to the amount with the same buying power at time B:
Examples – Carleton’s tuition • What is 1980’s $6,940 tuition equivalent to today? • 2003 dollars = 1980 dollars * (2003 CPI/1980 CPI) = $6,940 * (185.2/82.4) = $15,598 • Tuition rose nominally from $6,940 to $34,395 • But should compare tuitions in constant 2003 dollars, that is, $34,395 to $15,598 • Tuition rose by (34395-15598)/15598 = 120.5%
Examples – A personal trauma • 1962: The price of a DC Superman comic book goes up from 10¢ to 12¢ • Today it’s $2.95 • (12¢) * (185.2 / 30.2) = 74¢ is what it should be
Exercise: The Minimum Wage • Restate the minimum wage in constant 1960 dollars • Make two line graphs on the same axes, showing the actual minimum wage and the minimum wage in constant dollars • Explain what your graph shows about the history of the minimum wage
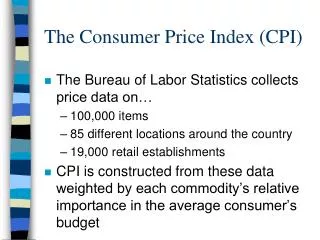
CPI: A closer look • Who is covered? • CPI market basket represents purchases of people living in urban areas • About 80% of U.S. population covered • How is market basket chosen? • By sampling! • Data from 29,000 households • Basket items are weighted
CPI: A closer look • How are prices determined? • By sampling! • Survey of 16,800 households • Each month, BLS records 80,000 prices in 85 cities at a sample of stores that represent actual buying habits • Market basket changes over time • From LP records to CDs; from beef to tofu
CPI controversies • Does a “fixed basket” approach overstate inflation? • If beef prices go up and rice prices stay the same, people will eat more rice • Should market basket reflect these changes in consumption? • Or should index account for this decline in standard of living?
CPI controversy • Old method • Last year I bought 1 head of iceberg and 1 head of romaine lettuce at $1.00 each, spending $2.00 total • Now price of romaine rises to $1.50 a head • I now spend $1.00 + $1.50 = $2.50, 25% increase • New method • Since romaine went up I’ll reduce how much romaine I buy but keep spending the same amount for each • I now buy 1.225 heads of iceberg and .816 heads of romaine spending the same on each, since 1.225 x ($1) = .816 x ($1.50). • Now I’ve spent $1.225 + $1.225 = $2.45, 22.5% increase
CPI and government statistics • What it is: CPI measures prices of goods and services over time • What it is not: Doesn’t measure changes to standard of living • CPI and government statistics need to be free from political influence to be accurate and timely • Canada has a single statistical office (see www.statcan.ca); ranked first among government statistical agencies • U.S. has 72 federal statistical offices