Download
1 / 15
230 likes | 510 Vues
ELECTRIC VEHICLES. Will Barnard Pam Becker Troy “Hugin” Noble Linda Sonne Jonathan Weiss Christian Wiest Ted Yu. Coming soon to your everyday life!. Agenda. EV Overview EV Value Proposition Bayesian Network Overview Results and Sensitivity Limitations of Model Recommendations.

E N D
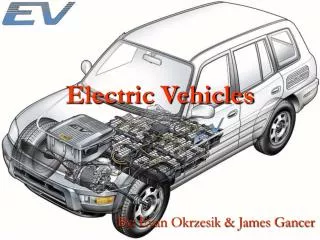
ELECTRIC VEHICLES Will Barnard Pam Becker Troy “Hugin” Noble Linda Sonne Jonathan Weiss Christian Wiest Ted Yu Coming soon to your everyday life!
Agenda • EV Overview • EV Value Proposition • Bayesian Network Overview • Results and Sensitivity • Limitations of Model • Recommendations
Why should people like driving an EV? • Quiet, Clean Driving Experience • High Performance • Lower Operating Costs • No Gas Stations - Refuel Where You Are! • Environmentally Friendly • Energy Security
What is the cost? • Vehicle • Purchase • Lease • Subsidies • Ownership • Battery Replacement • Wear and Tear • Refueling
Consumer Sensitivity Minimum Efficient Scale: 60% Acceptance Price: $1,000 Premium Range: 100 miles
Bayesian Network: Problem Statement: Determine the probability of success of EV’s for an existing car manufacturer.
Network Weights 0.35 0.20 0.20 0.15
Results and Sensitivity Analysis • Results: Probability (Supply = High) = 54.79% • Sensitivity: • If Consumer Demand has 100% probability of being high: Probability (Supply = High) = 69.94% • If Consumer Demand has 100% probability of being low: Probability (Supply = Low) = 34.94%
Limitations of model • Dilution of probabilities given high number of hierarchy levels • Independence of probabilities • Definition of influence weights • Constraint of two states of nature per node • Lack of consideration of time shifts
Recommendations • Investment • Prioritize according to influence of primary nodes • Create an implementation timeline • Demand • Continue to monitor external influences • Stakeholders • Partner for lobbying and product development