Download
1 / 41
420 likes | 618 Vues
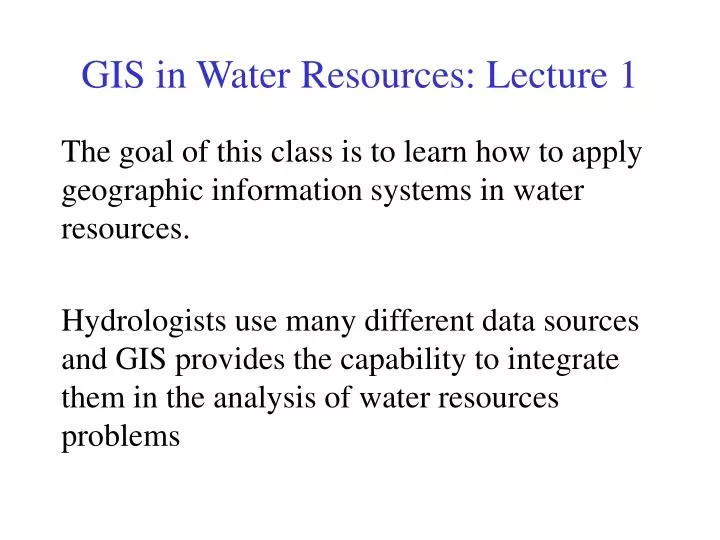
GIS in Water Resources: Lecture 1. The goal of this class is to learn how to apply geographic information systems in water resources. Hydrologists use many different data sources and GIS provides the capability to integrate them in the analysis of water resources problems. Our Classroom.

E N D
GIS in Water Resources: Lecture 1 The goal of this class is to learn how to apply geographic information systems in water resources. Hydrologists use many different data sources and GIS provides the capability to integrate them in the analysis of water resources problems
Our Classroom Dr Wayne Woldt, Dr Ayse Irmak students at University of Nebraska - Lincoln Dr David Tarboton Students at Utah State University Dr David Maidment students at UT Austin
GIS in Action: Hurricane Katrina – 1 year later Flooding in New Orleans http://www.msnbc.msn.com/id/9130254/ • Water mapping • where is the water • what is in the water? • Water movement • where is it going? http://msnbc.msn.com/id/9150429/ Issues for this course
Flooding in New Orleans http://lacpr.usace.army.mil/
GIS in Water Resources: Lecture 1 • In-class and distance learning • Geospatial database of hydrologic features • Arc Hydro data model • Curved earth and a flat map
Lectures Powerpoint slides Video streaming Readings “Arc Hydro: GIS in Water Resources” Homework Computer exercises Hand exercises Term Project Oral presentation HTML report Class Interaction Email Discussion Examinations Midterm, final Six Basic Course Elements
Instructor-Centered Presentation Community-Centered Presentation Learning Styles Instructor Student
Traditional Classroom Community Inside and Outside The Classroom University Without Walls
Distance Learning Dr Wayne Woldt, Dr Ayse Irmak students at University of Nebraska - Lincoln Dr David Tarboton Students at Utah State University Other People Other People Dr David Maidment students at UT Austin
GIS in Water Resources: Lecture 1 • In-class and distance learning • Geospatial database of hydrologic features • Arc Hydro data model • Curved earth and a flat map
Geographic Data Model • Conceptual Model – a set of concepts that describe a subject and allow reasoning about it • Mathematical Model – a conceptual model expressed in symbols and equations • Data Model – a conceptual model expressed in a data structure (e.g. ascii files, Excel tables, …..) • Geographic Data Model – a conceptual model for describing and reasoning about the world expressed in a GIS database
Spatial Data: Vector format Vector data are defined spatially: (x1,y1) Point - a pair of x and y coordinates vertex Line - a sequence of points Node Polygon - a closed set of lines
Themes or Data Layers Vector data: point, line or polygon features
Kissimmee watershed, Florida Themes
Raster and Vector Data Raster data are described by a cell grid, one value per cell Vector Raster Point Line Zone of cells Polygon
Santa Barbara, California http://srtm.usgs.gov/srtmimagegallery/index.html
How do we combine these data? Digital Elevation Models Streams Watersheds Waterbodies
GIS in Water Resources: Lecture 1 • In-class and distance learning • Geospatial database of hydrologic features • Arc Hydro data model • Curved earth and a flat map
Bringing together these two communities by using a common geospatial data model CRWR GIS CRWR GIS in Water Resources Consortium Water Resources
Data Model Based on Behavior “Follow a drop of water from where it falls on the land, to the stream, and all the way to the ocean.” R.M. Hirsch, USGS
Integrating Data Inventory using a Behavioral Model Relationships between objects linked by tracing path of water movement
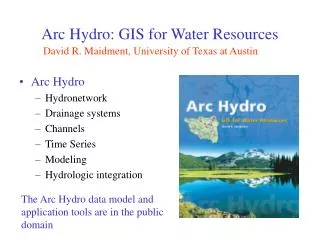
Arc Hydro: GIS for Water Resources Published by ESRI Press The Arc Hydro data model and application tools are in the public domain
Drainage System Hydro Network Flow Time Time Series Hydrography Channel System Arc Hydro Components
Analysis, Modeling, Decision Making Arc Hydro Geodatabase Hydrologic Information System A synthesis of geospatial and temporal data supporting hydrologic analysis and modeling
“White space” is the Grey at Dobson minus Ahaura, Arnold and Grey at Waipuna
FLOODPLAIN MAP Nexrad Map to Flood Map in Model Builder Flood map as output Model for flood flow HMS Model for flood depth Nexrad map as input
GIS in Water Resources: Lecture 1 • In-class and distance learning • Geospatial database of hydrologic features • Arc Hydro data model • Curved earth and a flat map
Origin of Geographic Coordinates Equator (0,0) Prime Meridian
Latitude and Longitude Longitude line (Meridian) N W E S Range: 180ºW - 0º - 180ºE Latitude line (Parallel) N W E S (0ºN, 0ºE) Equator, Prime Meridian Range: 90ºS - 0º - 90ºN
Latitude and Longitude in North America Austin: (30°N, 98°W) Logan: (42°N, 112°W) 60 N 30 N 60 W 120 W 90 W 0 N
Map Projection Flat Map Cartesian coordinates: x,y (Easting & Northing) Curved Earth Geographic coordinates: f, l (Latitude & Longitude)
Representative Fraction Globe distanceEarth distance = Earth to Globe to Map Map Projection: Map Scale: Scale Factor Map distanceGlobe distance = (e.g. 0.9996) (e.g. 1:24,000)
Coordinate Systems A planar coordinate system is defined by a pair of orthogonal (x,y) axes drawn through an origin Y X Origin (xo,yo) (fo,lo)