Download
1 / 17
170 likes | 430 Vues
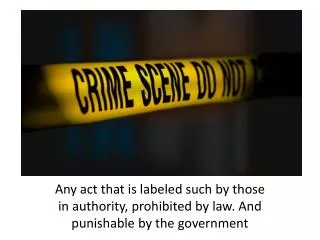
Production of Crime Statistics. Measuring Crime Statistics Chapter 3. When attempting to understand, predict, and control any social problem, including the crime problem, the first step is to determine its extent. Three categories of major crime data sources in the United States:

E N D
Production of Crime Statistics Measuring Crime Statistics Chapter 3
When attempting to understand, predict, and control any social problem, including the crime problem, the first step is to determine its extent. Three categories of major crime data sources in the United States: Official statistics Victimization survey data Self-reported data Categorizing and Measuring Crime and Criminal Behavior
Three Major Sources of Crime Statistics Uniform Crime Reports (UCR) - collected by local police departments and forwarded to the FBI. – good or bad? - NIBRS - “new” – what is it? – good or bad? National Crime Victimization Surveys (NCVS) - conducted jointly by the U.S. Census Bureau and the U.S. Department of Justice. - good or bad Self-Report Data (SRD) - conducted by independent researchers. - good or bad?
Review of Research Methodology • Theories are often grounded in crime stats, stats are used to test theories, stats. guide theory and research to address increases and decreases. • Independent and dependent variables. • Correlation (-1 to 1)– strength of a relationship • Causality – cause precedes the outcome while other causal/potentially causal factors are controlled. • Cross-sectional and longitudinal research designs. • Micro-level and macro-level analyses. • Sampling. • Generalizability (apply to population), validity correctly inferred, produced desired result), and reliability (replicability).
History of Official Crime Statistics • Knowledge about the extent and distribution of crime in the United States prior to the twentieth century was based primarily upon local arrest statistics, court records, and jail and prison data. – no uniformity! – Q?- how do you work with that to develop any degree of understanding of crime? • Answer - you can’t! • The International Association of Chiefs of Police (IACP). – led the way for adoption of uniform reporting and recording in 1929 • The Uniform Crime Reports (UCR) was the result. http://www.fbi.gov/ucr/ucr.htm
Part I (Index Crimes) Criminal homicide Forcible rape Robbery Aggravated assault Burglary Larceny-theft Motor vehicle theft Arson Part I offenses include those illegal acts considered to be particularly serious that “occur with sufficient frequency to provide an adequate basis for comparison” (U.S. Department of Justice, 1980:3) Part II (Non-Index Crimes) Part II offenses include most other crimes not itemized in Part I. Twenty specific crimes and a catchall “other” category are in this section, including other assaults, embezzlement, vandalism, sex offenses, drunkenness, and status offenses. (reporting only includes cries that are cleared by an arrest) Description of theUniform Crime Reports
Strengths and Weaknesses of the UCR • Strengths • Easily accessible and relatively inexpensive to obtain. • Lots of data available to work with and do research – SHR data • The UCR responds to political and societal pressures to record additional information about new developments – example? • May not like it but it’s better than arrest or conviction rates – why? • How do you calculate a rate? How do you compare it across time and place? What about different denominators – more or less appropriate for rape, vehicle theft, etc. • Weaknesses • The UCR’s emphasis upon conventional street crimes and its exclusion of other serious crimes. • Internet, white collar, federal, • The UCR can be a tool for political manipulation especially since “street” crimes seem to be the only thing that matters given the UCR bias. This is currently going on – rise in murder rate and other violent crimes. • Problems also arise from recording practices - i.e., definitions of crimes. • Problem with the way crimes are counted. – hierarchical rule? • Crime rates are misleading (Las Vegas). • It has a reactive nature - private citizens must report crime.
Every 23.1 seconds: One Violent Crime Every 32.6 minutes: One Murder Every 5.6 minutes: One Forcible Rape Every 1.3 minutes: One Robbery Every 36.9 seconds: One Aggravated Assault Every 3.1 seconds: One Property Crime Every 14.7 seconds: One Burglary Every 4.5 seconds: One Larceny-theft Every 25.5 seconds: One Motor Vehicle Theft Figure 1. The FBI's Crime Clock
Alternative Measures of Crime:NIBRS – http://www.icpsr.umich.edu/NACJD/NIBRS/- a new source of official records data • Response to criticism about UCR • Introduced in 1984 and today is used by abt. half of all states – slow to adopt though. • 2 purposes: 1) enhance quantity, quality and timeliness of data collected; 2) improve the methodology for compiling, analyzing, and publishing data • Much more detail provided compared to UCR (46 A and 11 B offenses) • Avoids Hierarchical rule • Records Group A and B offenses instead of Part I and II • Both groups are much more inclusive than UCR (list on pg. 98) • Lots of data entry errors – personal experience – CPV age, intimidate to death
Strengths and Weaknesses of the NIBRS • Strengths • Has both a victim file and an offender file that can be worked with a various levels of aggregation – local, state, U.S., etc. • Lots of data available to work with and do research – • Can study and look at event characteristics including weapons, drugs, alcohol ,etc. – not as many as would like but a few… • Broader age rage for both victim and offender available than some other sources provide • Individual level data is available from arrest records and victim reports available • Etc. • Weaknesses • Only crimes reported to the police are recorded – similar to UCR in this respect. • Has a steep learning curve for departments and requireds a good deal of training and resources. • States, counties, depts. Have been slow to embrace and adapt hence only about half of all states participating • Major prob. Is doing longitudinal and looking at trends over time – each year more places join or drop off reporting list.Problems also arise from recording practices - i.e., definitions of crimes.
Alternative Measures of Crime Self-Report Studies – been instrumental in explaining etiology delinquency. Primary target population is juveniles. • Short and Nye (1957) – first major work - revealed a different image of the juvenile delinquent and the extent of delinquency than official records had previously portrayed (SES and quality of family life not related to delinquency) • The National Youth Survey (NYS) – 1977- – outstanding study – great methodology – cohort study of 1700 - expensive & elaborate - developed to resemble the crime categories of the UCR • The Project on Human Development in Chicago Neighborhoods (PHDCN). – MacArthur funded project – a longitudinal probability sample of 80 city neighborhoods (6200 kids in 7 cohorts w/ follow up)
Strengths and Weaknessesof Self-Report Data • Strengths • Uncovers the “dark figure” of crime - the police were only being informed about or discovering a relatively small fraction of the crime that was occurring. • Self-report studies go straight to the point of investigation. • The self-report technique is not subject to manipulation or politicization. • Weaknesses • Self-report studies have been conducted primarily with adolescent populations. Etiology has been focus so this is understandable but should be validated with other populations. • Places an emphasis upon trivial offenses and status offenses (?) , especially in the NYS making comparisons to adult crimes impossible . • The time frame it considers – memory recall issues - i.e., one year in the NYS. • Methodological concerns - sampling, selective responding/socially desirable, falsification, validity, reliability, memory decay, interviewer measurement error. • Solution – identify deception, promote anonymity, new techniques (UCT)
Victimization Studies The National Crime Victimization Survey (NCVS) (pg. 114)- http://www.icpsr.umich.edu/NACJD/NCVS/ • Conducted by the U.S. Census Bureau with DOJ. • Questions are asked about fear of crime, the perceived decline or improvement of the neighborhood in regard to crime, and about steps that have been taken to protect the household against victimization. • Has been redesigned to help with incident recall
Strengths of Victimization Surveys • Can be compared with the UCR and therefore is a validity check. • Violent crime down but rape up – how so? • Can be used to study geographical and temporal variations in the crime rate. • Can provide a basis for evaluating local and national law enforcement practices. • A lot of information is collected about relatively few crimes. • Because of its panel design, it is also possible to examine the psychosocial effects of victimization upon victims.
Weaknesses of Victimization Surveys • Problems with falsification, series events, interviewer effect, and sampling, coding – see rape example on pg. 116. • Underreporting resulted from the household-respondent method of data collection. • Cost. • Recording difficulty because many victimizations reported represent trivial offenses, and the surveys record crimes committed against households and individuals. • Problems with reliability because individuals vary in their reporting of victimization.
Comparison of UCR, SRD,and NCVS Data Sources • They paint different pictures of crime in the United States. • Definitional differences among the three sources. • UCR and NCVS allow city comparisons - the UCR records crimes that occur in the city, whereas the NCVS measures crimes that happened to city residents. • Differences exist with regard to how the data get recorded.
Other Measures of Crime • Cohort Studies • Biographies • Observational Studies • Another important source of data for theory testing in Crim. and operationalization (?) comes from the Census Bureau – examples…