Download
1 / 19
190 likes | 547 Vues
Using the calculator to find the Line of Best Fit. For the TI – 84 Plus. Lesson Objective: NCSCOS 3.03b Students will know how to find the line of best fit from a table using their calculators. Line of Best Fit. Create a linear model that best represents the data in the table.

E N D
Using the calculator to find the Line of Best Fit For the TI – 84 Plus
Lesson Objective: NCSCOS 3.03b • Students will know how to find the line of best fit from a table using their calculators
Line of Best Fit • Create a linear model that best represents the data in the table. • Identify the slope • Identify the y-intercept • Find the value of y when x is -3
Line of Best Fit • Graph the points 5 10 15 20 25 30 35 40 2 4 6 8 10 12 14
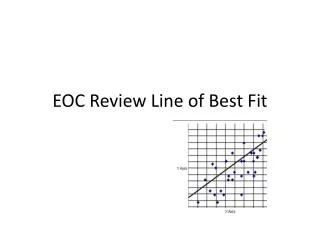
Line of Best Fit • Notice how they “kinda” make a line • We can find a line that is a good fit for the information • We call the Line of Best Fit 5 10 15 20 25 30 35 2 4 6 8 10 12 14
Line of Best Fit • The Line of Best Fit is the line that comes closest to all the points. 5 10 15 20 25 30 35 2 4 6 8 10 12 14
Line of Best Fit • We don’t have to guess which line is best • We can use the calculator to find the Line of Best Fit 5 10 15 20 25 30 35 2 4 6 8 10 12 14
Line of Best Fit • On your calculator, hit the “STAT” button • Hit 1: Edit • The next screen should have L1 and L2 at the top. • If there’s anything in either column, highlight the L1, hit “CLEAR” then ENTER
Line of Best Fit • In the first column, type in the x values • In L2, type in the y values • Hit QUIT (2ND MODE)
Line of Best Fit • Hit STAT CALC • Hit 4: LinReg (ax+b) • It should now just say LinReg(ax+b) on your screen
Line of Best Fit • Hit ALPHA TRACE • You should see a pull-up menu of y’s. Select y1 and hit enter. You can choose to put it in any of the y’s but for this practice use y1 • You should now see LinReg(ax+b) y1 • Hit enter
Line of Best Fit • Your screen should now look like: • In this format, a is the same as m, so your slope is 2.16 • b is still the b, so the y-intercept is 6.6 • To see the actual equation, hit the y= button • Notice the equation is at y1
Line of Best Fit • If you hit the GRAPH button you will see the graph appear on the screen • You can then press 2nd GRAPH (TABLE) to get a table of numbers • You can then use that to find what y is when x is -3 (.12)
Line of Best Fit • To find what y is when x is a big number, press 2nd WINDOW (TBLSET) • Change TblStart to the x value for the number you’re trying to find • Change the ^Tbl to the decimal you need (.o1) • Press 2nd GRAPH (TABLE) • You should see your answer
Line of Best Fit • Create a linear model that best represents the data in the table • Identify the Slope • Identify the Y-intercept • Find the value of x when y = 75.85
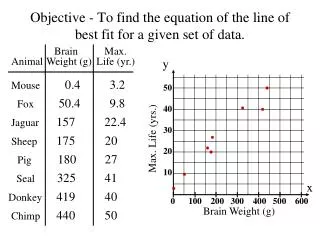
Line of Best Fit • Five students in Ms. Brown’s Algebra class reported the number of hours that they studied for a test. The number of hours and their test scores are in the table.
Line of Best Fit • Create a linear model that best represents the data in the table • According to the linear model, what is the predicted test score of a student who studied 1 hour for the test
Line of Best Fit • The table shows the changes in the minimum wage since 1980. According to the line of best fit for the data, what is the predicted minimum wage for the year 2010? (let x = 80 represent 1980)
Line of Best Fit • In 1870, Lonesome Dove was a prosperous western town with 12,000 people when the railroad decided to change routes. The table shows Lonesome Dove’s population decline in subsequent decades. According to the line of best fit, what was the population in 1896? Let x = 0 represent 1870.