Download
1 / 34
340 likes | 348 Vues
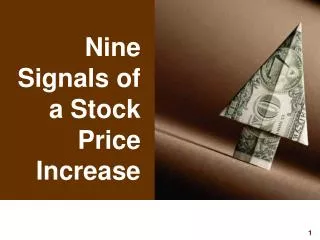
Successful Stock Signals. Introduction. Presentation of the book “Successful Stock Signals for Traders and Portfolio Managers” By Tom Lloyd Sr., author Articles in MarketWatch.com SeekingAlpha.com Technical Analysis of Stocks and Commodities Magazine. Marc Chaikin.

E N D
Successful Stock Signals for traders and portfolio managers
Introduction • Presentation of the book “Successful Stock Signals for Traders and Portfolio Managers” • By Tom Lloyd Sr., author • Articles in MarketWatch.com • SeekingAlpha.com • Technical Analysis of Stocks and Commodities Magazine for traders and portfolio managers
Marc Chaikin “As a strong believer in the importance of combining fundamentals with technical analysis, I was immediately engaged in this book by Tom Lloyd. Successful Stock Signals reads like a trading diary written in the moment. WITH ITS WEALTH OF CHARTS THE READER SEES A CLEAR CUT PATH TO PROFITS. Tom puts you in the driver’s seat as he analyzes stock after stock with the tools he has used successfully in a long Wall Street career. IF YOU WANT TO MAKE CONSISTENT PROFITS IN THE STOCK MARKET, THIS BOOK IS A MUST READ.” for traders and portfolio managers
Jeff Hirsch “I have been following Tom Lloyd’s timely signals for decades. In this treatise Tom Lloyd pulls together a library’s worth of the most effective technical analysis tools and MARKET TIMING TRICKS OF THE TRADE. TRADE LIKE A PRO WITH TOM’S SIGNALS PLAYBOOK.” for traders and portfolio managers
Chip Anderson • “Successful Stock Signals quickly focuses in on the key things technical investors need to concentrate on in order to be successful—technical signals that work. UNLIKE MANY OTHER INVESTING BOOKS THAT BEAT AROUND THE BUSH, TOM LLOYD GIVES YOU GREAT, USABLE ADVICE THAT CAN HELP ANYONE FIND GREAT TRADING OPPORTUNITIES IN ANY MARKET.” for traders and portfolio managers
Topics of Discussion • Integrating technical analysis with fundamentals • Use technical analysis as the first step in selecting stocks--trading • Use fundamental analysis as the second step--investing • This approach keeps you in stocks beating the Index and having good fundamentals • Buy & Sell Signals illustrated for traders and portfolio managers
Trading • Successful Signals for Traders • Candlesticks: Hammer and Hanging Man reversal signals • RSI, Relative Strength Index • MACD, Mac Dee, Moving Average Convergence Divergence • Fast Stochastic • Support and Resistance for traders and portfolio managers
Technicals vs. Fundamentals • Traders use technicals • Portfolio managers use fundamentals • Traders look at fundamentals • Portfolio managers look at technicals for traders and portfolio managers
Investing • Successful Signals for Portfolio Managers • 200-day moving average • Relative Strength vs. Index • The crosses: 50-day X 200-day • Know Sure Thing • Chaikin Money Flow • On-Balance Volume for traders and portfolio managers
HPQ BEATS IBM for traders and portfolio managers
Beat the Index • IBM 50-yr. turtle beating the Index • HPQ 50-yr hare beating the Index • IBM “better name” • HPQ “better performance” • Now does the turtle catch the hare? • Picking long-term best performers for traders and portfolio managers
HPQ TROUNCES THE INDEX for traders and portfolio managers
Successful Signals MSFT • Double top • “W” bottom • Bullish rectangle • Breakout • Long-term flat lined chart • No growth for 10 years • Can you believe the breakout? for traders and portfolio managers
Shaky Signals LULU • Long-term, 5-year, 200-day uptrend with violations. • 2- year uptrend with violations • Uptrend in Relative Strength with violations • On-balance volume and MFI show weakness • Chaikin money green 2 years, but sharp drop recently. • Bounces after earnings for traders and portfolio managers
Successful Signals LULU • MACD • Stochastic • RSI • Keltner Channels • Pivot Point • Parabolic SAR • Directional Movement D1 D2 • Relative Strength • MFI • On-balance volume for traders and portfolio managers
Successful Signals LNKD • Money flow turns positive at $70 • 20-day crosses above 50-day MA • MACD shows buying • MFI turns up • OBV turns up • AD, Accum/Distr moves up • Market turns up • Price moves from $70 to $120 for traders and portfolio managers
Successful SignalsLong Term, SBUX • Monthly chart for long term signals • Chaikin money flow shows buy and sell signals • MACD histogram leads money flow • Double top, Candlestick bottom • Stochastic leads MACD buy/sell • RSI confirms the Stochastic • OBV, RS and +D1-D1 buy/sell for traders and portfolio managers
Successful Signals CRM • Price violates 200-day • 50-day MA comes down to 200 • Price recovers above 200-day MA • 50-day bounces up from 200 • Money flow turns green before eps • After eps big white candle closes at 148.54 up 1.77 for traders and portfolio managers
Successful SignalsTrading CRM • Do you buy on the open? • Opens at $148 • MACD, RSI, Stochastic buy signals • Parabolic SAR buy signal • 50-min and 200-min uptrends • Price running along the top of the upward Bollinger Band for traders and portfolio managers
DAY TRADINGSALESFORCE.COMMONDAY, 8/27/12buy 148, sell 152 Buy bottom, sell top Buy bottom, for traders and portfolio managers
Successful Signals HD • Breakout buy from $38 to $65 • Candlestick signals lead • Relative Strength leads • +D1-D1 Directional leads • Volume/price breakout at $40 • Golden cross 50-day X 200-day • OBV and ADX confirm • Signals remain positive to $65 for traders and portfolio managers
Successful SignalsTA+Fundamentals • First step: find a good chart • Second step: find good fundamentals • S&P chart combines both TA and fundamentals • Home Depot chart shows earnings, analyst target, star rating plus TA signals Rel.Strength, Moving Avg. for traders and portfolio managers
Successful Signals WMT • Breakout at $55 runs up to $78 • Pre-breakout signals: RSI, Candlesticks, Relative Strength, price gap, +D1-D1 Direction, and PPO • Concurrent signals: Chaikin money flow, change in trend and ADX • TA + Fundamentals agree for traders and portfolio managers
Successful SignalsShort squeeze • GMCR positive surprise creates short squeeze • Day trading the bounce up from the bottom • Big gap up no retracement very bullish • Day trading the pullback in Stochastic and MACD for traders and portfolio managers
Successful Signals SPY • Long-term market signals 20 years • SPY surrogate for S&P 500 • 5 Elliott waves to double top in 2000 at 124.55 or near 1246 S&P • 5 Elliott wave to head & shoulders top in 2007 at 141.53 near 1415 • Currently in the 5th Elliott wave at 150 or near 1500 for traders and portfolio managers
Successful Signals SPY • Long-term 10-year signals • Sell signals in 2008 crash • Buy signals in 2009 Fed rescue • OBV buy signal at bottom at $75 • RSI and Stochastic buy at $80 • MACD buy at $100 • Money flow buy at $100 for traders and portfolio managers
Successful Signals SPY • Weekly chart buy/sell signals • Buy test of 200-day uptrend • Sell the RSI and Stochastic overbought signals • 200 and 50-day uptrend • Latest Stochastic buy signal • Not yet confirmed by MACD buy signal for traders and portfolio managers
Successful Signals SPY • Short term triple top • All signals turn negative • Start of short term selling cycle • MACD, Stochastic RSI and Know Sure Thing are leading signals to drop in price • Buy signals on the bounce back up for traders and portfolio managers
Successful Signals Summary • Charts are 100% accurate in signaling changes in supply and demand. • No one should be surprised where price is going, signals tell you that. • Fundamentals are only one factor creating supply and demand • For traders,signals of supply/demand are more important than fundamentals • For portfolio managers fundamentals are the factor for determining price targets. for traders and portfolio managers
Conclusions • For traders, use leading indicators to identify supply and demand ahead of the crowd and high frequency traders. • For portfolio managers use leading indicators of Relative Strength so stocks outperform the benchmarks. • Use TA and then Fundamentals • Pick good charts check for good fundamentals. Avoids value traps. • Keeps portfolio in outperforming stocks. for traders and portfolio managers