Download
1 / 1
10 likes | 105 Vues
1000. 3500. 900. PCBs. p,p ’ -DDE. 3000. 800. Mie. 700. 2500. 600. 2000. 500. Wakayama-II. 1500. 400. 300. Wakayama-I. 1000. 200. 500. 100. Nagasaki. 0. 0. Kochi. 500. 300. 450. Trans-nonachlor. Q1. 250. Kagoshima. 400. 350. 200. Okinawa. 300. 250. 150.

E N D
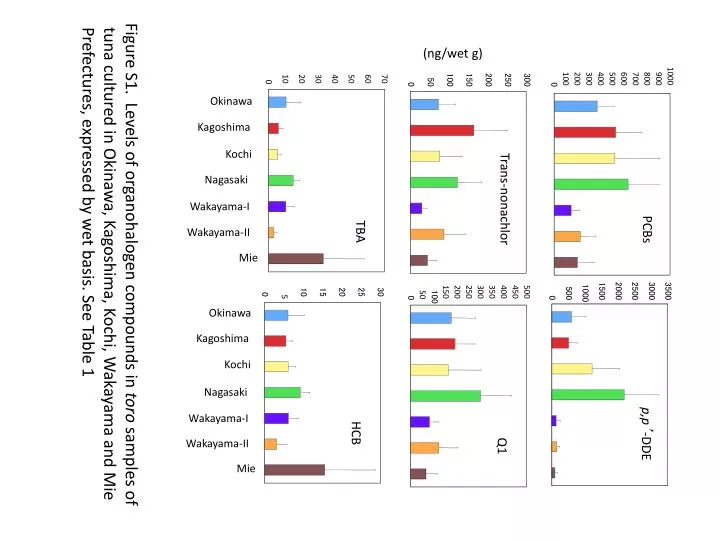
1000 3500 900 PCBs p,p’-DDE 3000 800 Mie 700 2500 600 2000 500 Wakayama-II 1500 400 300 Wakayama-I 1000 200 500 100 Nagasaki 0 0 Kochi 500 300 450 Trans-nonachlor Q1 250 Kagoshima 400 350 200 Okinawa 300 250 150 (ng/wet g) 200 100 150 100 50 Mie 50 0 0 Wakayama-II 70 30 Wakayama-I 60 TBA HCB 25 50 Nagasaki 20 40 15 Kochi 30 10 20 Kagoshima 10 5 Okinawa 0 0 Figure S1. Levels of organohalogen compounds in toro samples of tuna cultured in Okinawa, Kagoshima, Kochi, Wakayama and Mie Prefectures, expressed by wet basis. See Table 1